What is Cost of Quality (COQ): Understanding Cost of Good Quality and Cost of Poor Quality
Cost of Quality (COQ) is more than what a company spends on inspections, audits, or its Quality department. From my experience working with quality and process-improvement activities, I see COQ as the financial impact of both achieving quality and dealing with quality problems when they occur.
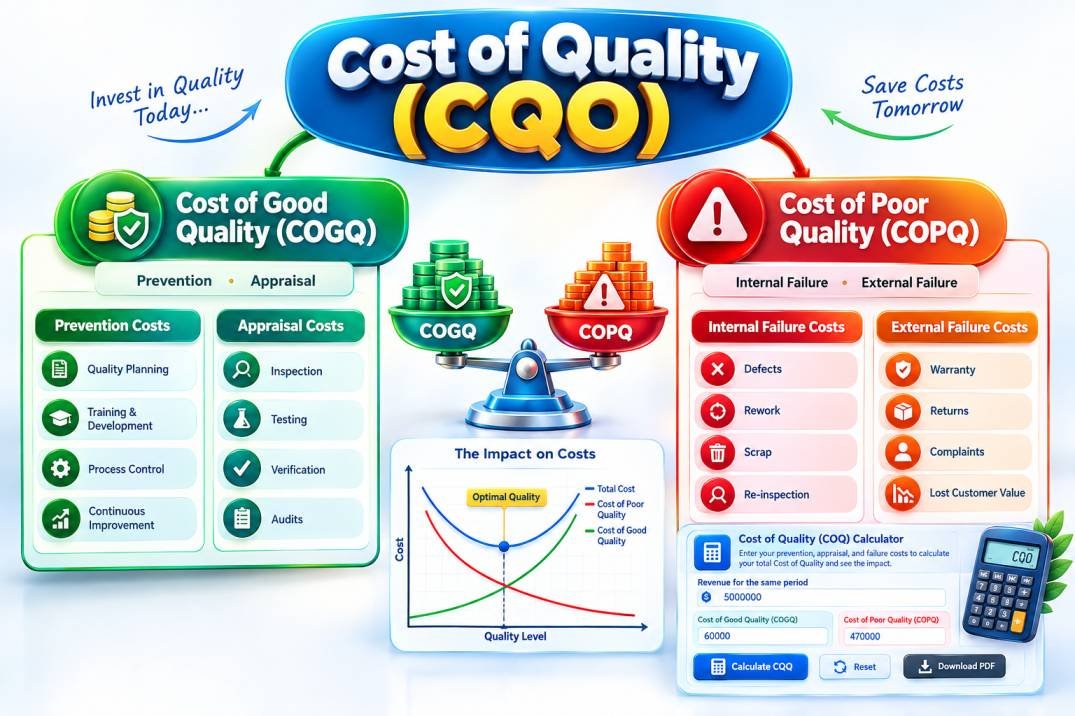
I have seen organizations spend considerable time and resources on rework, defect investigations, customer complaints, repeated testing, and production delays. The interesting part is that these costs are often treated as normal operating expenses rather than recognized as the cost of poor quality. That is where COQ becomes useful. It helps shift the conversation from “How many defects did we have?” to “What are those defects actually costing us?” It also highlights whether investing in prevention and better processes could reduce much larger failure costs later.
In simple terms, COQ helps connect quality performance with business performance—making it easier to see where quality investments create value and where avoidable costs are eating into profitability.
What is Cost of Quality (COQ)?
Cost of Quality (COQ) is the total cost associated with achieving quality and managing quality-related failures within an organization. In simple terms, it represents both the money spent to ensure products or services meet requirements and the money lost when they do not. It goes well beyond inspection and testing; it can also include prevention, rework, scrap, investigations, complaints, warranty, and other failure-related costs.
What makes COQ particularly valuable is that it connects quality performance directly to business performance. Instead of viewing quality as a compliance requirement, COQ helps organizations understand the financial consequences of good and poor decision-making. It provides a framework for evaluating whether resources are being invested in prevention or spent reacting to problems after they occur.
This concept becomes even more powerful when combined with improvement methodologies. For example, tools such as 5 Whys and Fishbone Diagrams can help uncover the root causes behind quality-related costs, while FMEA (Failure Mode and Effects Analysis) can identify potential risks before they lead to expensive failures. Similarly, improving Process Capability (Cp & Cpk) can reduce variation and help prevent many of the internal and external failure costs that contribute to poor quality.
So, in simple terms:
For me, the real value of COQ is not simply calculating a number. It is using that number to identify where prevention can eliminate recurring failure costs and improve both quality and business performance.
Cost of Good Quality (COGQ) vs Cost of Poor Quality (COPQ)
One thing I’ve learned from working in quality and continuous improvement is that not every quality-related cost is bad. Some costs help prevent problems, while others exist because problems have already occurred. This distinction is the foundation of Cost of Good Quality (COGQ) and Cost of Poor Quality (COPQ). The simplest way to understand COGQ vs COPQ is to ask one question: Are we spending money to prevent a problem, or spending money because the problem already happened?
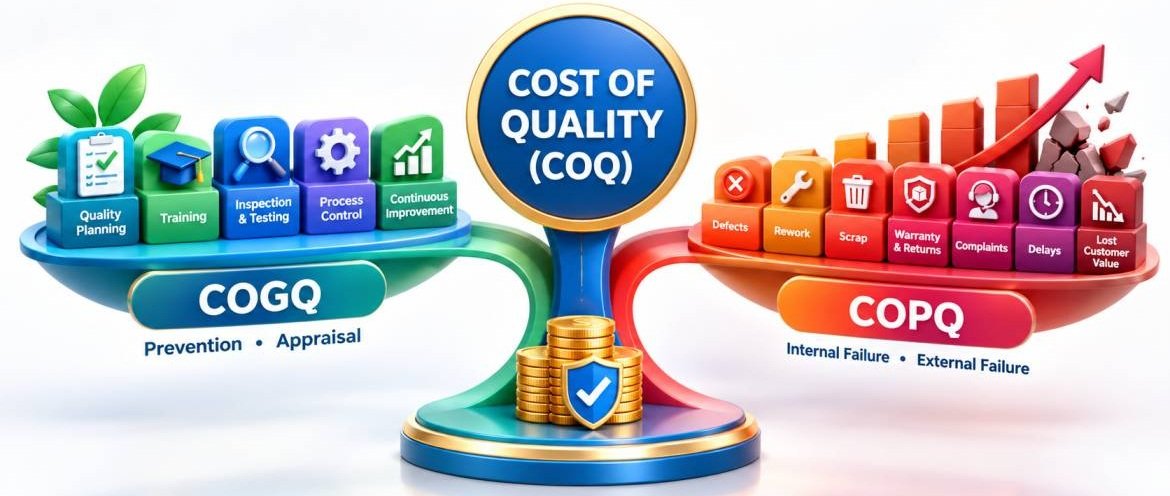
In my experience, the important part is not trying to eliminate COGQ. The real opportunity is to make prevention effective enough that COPQ comes down. For example, identifying a potential failure through FMEA or improving process capability before defects occur can be far less costly than repeatedly fixing the same issue later.
So, in practical terms, COGQ is the investment we make to get quality right; COPQ is the price we pay when we don’t.
What are the two Categories of Cost of Quality?
Cost of Quality (COQ) becomes much easier when you break it into two simple categories: the cost of preventing problems and the cost of dealing with problems after they occur.
Cost of Conformance (Cost of Good Quality) — Doing It Right
Cost of Conformance is the investment made to meet requirements the first time. It includes prevention activities such as training, FMEA, process improvement, and preventive maintenance, along with appraisal activities such as inspection, testing, audits, and measurement.
Prevention Costs
Prevention Costs are part of Cost of Good Quality (COGQ) and represent what an organization invests to prevent defects before they occur. From my experience, this is often where quality delivers the greatest return—good planning, training, FMEA, process improvement, supplier controls, and mistake-proofing can prevent much higher costs from scrap, rework, complaints, and warranty issues later.
The principle is simple: invest early to prevent problems rather than pay more to fix them afterward.
Appraisal Costs
Appraisal costs are part of the Cost of Good Quality (COGQ) because their purpose is to detect non-conformances before they create larger operational or customer-related problems. From my experience, appraisal adds the most value when it detects issues early, before they turn into rework, scrap, or customer-facing failures.
Typical examples include inspection, testing, audits, measurement, calibration, and verification.
The goal is not to inspect everything—it is to get the right level of verification at the right stage of the process.
Cost of Non-Conformance (Cost of Poor Quality) — Fixing What Went Wrong
Cost of Nonconformance, often associated with Cost of Poor Quality (COPQ), arises when requirements are not met. It includes internal failures such as scrap, rework, and repair, and external failures such as complaints, returns, warranty claims, and field failures.
Internal Failure Costs
nternal Failure Costs are part of Cost of Poor Quality (COPQ) and occur when defects or nonconformances are found before the product reaches the customer. From my experience, the direct cost of scrap or rework is often only part of the impact; the real loss can also include additional labor, investigation, retesting, and production time.
Common examples include scrap, rework, repair, retesting, re-inspection, sorting, containment, and quality-related downtime.
I look at internal failure cost as a simple warning sign: the problem was caught internally, but the process still paid for the mistake. Reducing these costs usually means addressing the root cause rather than relying only on additional inspection. Tools such as 5 Whys, Fishbone Analysis, FMEA, and Process Capability (Cp & Cpk) can help prevent recurring failures.
External Failure Costs
External Failure Costs are part of Cost of Poor Quality (COPQ) and occur when a defect or nonconformance is discovered after the product or service reaches the customer. From my experience, this is where a quality issue can quickly become a business issue—not just a technical one.
Typical examples include customer complaints, returns, warranty claims, repairs, recalls, replacements, and field failures.
What I have seen repeatedly is that the direct cost of the failure is only part of the story. An escaped defect can also require investigation, additional testing, corrective action, customer support, and sometimes expedited recovery efforts. More importantly, it can affect customer confidence and future business.
Internal failure costs stay within the process; external failure costs reach the customer.
That is why preventing failures before release is so important. Tools such as FMEA, Poka-Yoke, Process Capability (Cp & Cpk), and Root Cause Analysis can help reduce the chance of defects escaping to the customer.
🎓 Top-Rated Courses & Certifications
Try changing your filters or searching for another course.
Cost of Quality Formula
Where:
Understanding the Cost of Quality (COQ)
The Cost of Quality (COQ) is not simply the money a business spends on inspections, audits, or quality tools. It is the total financial impact of preventing problems, checking whether requirements are being met, and dealing with failures when something goes wrong.
In my experience working in quality and risk management, I have seen that quality problems rarely remain isolated technical issues. A defect can quickly lead to rework, investigation, project delays, additional testing, customer complaints, or regulatory concerns. The visible cost may be easy to calculate, but the time, capacity, and customer confidence lost along the way can be far more damaging.
This is why I view quality spending as an investment rather than an expense. Organizations that identify risks early and strengthen their processes before failures occur usually avoid the much higher cost of correcting problems later. The objective is not to spend endlessly on quality activities. It is to invest in the right controls at the right stage.
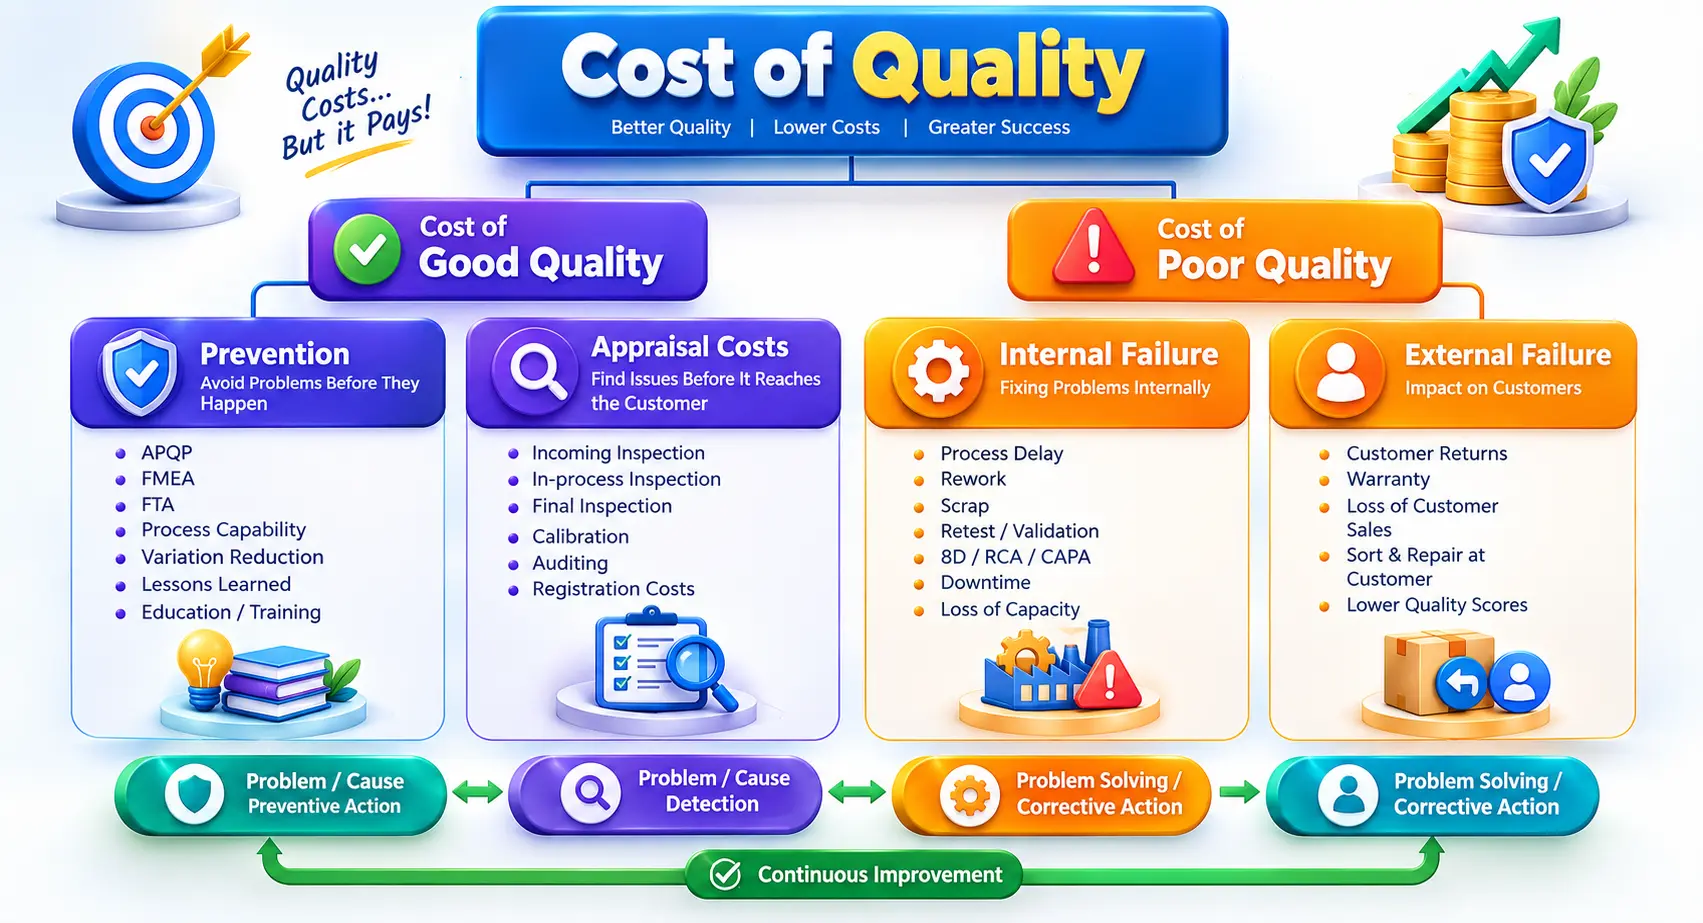
A well-managed Cost of Quality approach helps leaders understand where quality-related resources are being used and whether those investments are producing meaningful business value. When prevention becomes part of everyday decision-making, quality supports more than compliance. It contributes to reliable products, stronger customer trust, efficient operations, and sustainable profitability.
How to Calculate Cost of Quality
Many organizations overcomplicate the calculation of Cost of Quality (COQ). The formula itself is relatively straightforward. The real challenge is identifying all the costs that are often hidden across different departments, processes, and activities.
Step 1: Calculate Prevention Costs
Add all expenses associated with preventing defects and improving process performance, such as training, preventive maintenance, supplier audits, FMEA activities, process capability studies, and quality planning.
Step 2: Calculate Appraisal Costs
Sum the costs related to inspections, testing, audits, calibration, verification, and validation activities used to assess quality performance.
Step 3: Calculate Internal Failure Costs
Include the costs of scrap, rework, retesting, production downtime, sorting, investigations, and corrective actions identified before the product reaches the customer.
Step 4: Calculate External Failure Costs
Add customer-facing quality costs such as complaints, returns, warranty claims, recalls, field repairs, replacements, and other post-delivery issues.
Step 5: Calculate Total Costs of Quality
Combine all four categories:
The important part is not just getting the total. I usually look at where the money is going and whether failure costs are trending down. Repeated rework, investigations, retesting, delays, or customer issues can reveal improvement opportunities that a simple scrap report may miss.
Ultimately, COQ calculation should help answer one practical question: Are we investing enough in prevention to reduce what we are paying for failures?
Cost of Quality Example
Consider a manufacturing company that produces precision components. The company invests in prevention and appraisal activities throughout the year. These costs are incurred to prevent defects and verify that products meet quality requirements.
| Quality Activity / Cost | Monthly Cost |
|---|---|
| Employee Quality Training | ₹20,000 |
| Supplier Qualification | ₹15,000 |
| FMEA and Process Improvement | ₹25,000 |
| Incoming Inspection | ₹18,000 |
| Product Testing | ₹22,000 |
| Scrap Due to Defects | ₹35,000 |
| Rework and Repair | ₹30,000 |
| Retesting After Rework | ₹10,000 |
| Customer Returns | ₹25,000 |
| Warranty Claims | ₹20,000 |
| Customer Complaint Investigation | ₹10,000 |
Step 1: Classify Each Cost
Now classify each activity according to where the cost occurs.
Prevention Costs
- Employee quality training = ₹20,000
- Supplier qualification = ₹15,000
- FMEA and process improvement = ₹25,000
Total Prevention = ₹60,000
Appraisal Costs
- Incoming inspection = ₹18,000
- Product testing = ₹22,000
Total Appraisal = ₹40,000
Internal Failure Costs
- Scrap due to defects = ₹35,000
- Rework and repair = ₹30,000
- Retesting after rework = ₹10,000
Total Internal Failure = ₹75,000
External Failure Costs
- Customer returns = ₹25,000
- Warranty claims = ₹20,000
- Customer complaint investigation = ₹10,000
Total External Failure = ₹55,000
Step 2: Calculate COGQ
Cost of Good Quality includes Prevention + Appraisal:
COGQ = ₹60,000 + ₹40,000 = ₹100,000
Step 3: Calculate COPQ
Cost of Poor Quality includes Internal Failure + External Failure:
COPQ = ₹75,000 + ₹55,000 = ₹130,000
Step 4: Calculate Total COQ
COQ = COGQ + COPQ
COQ = ₹100,000 + ₹130,000 = ₹230,000
What Does This Tell Us?
The company spent ₹100,000 to achieve and verify quality, but ₹130,000 dealing with failures.
From my experience, this is where the COQ analysis becomes useful. The total ₹230,000 is important, but the ₹130,000 COPQ deserves closer attention because it shows where the process is losing money. A Pareto analysis of the ₹130,000 could help identify whether scrap, rework, warranty, or another failure is the biggest contributor.
The objective would not be to simply cut the ₹100,000 spent on prevention and appraisal. The better question is whether targeted prevention can reduce the ₹130,000 failure cost.
📚 Recommended Books for Professionals
Try removing one or more filters.
How Cost of Quality Affects Profitability
From my experience, quality affects profitability long before a problem appears on the income statement. Scrap, rework, repeated testing, production delays, customer complaints, and warranty claims all consume resources that could otherwise be used to create value.
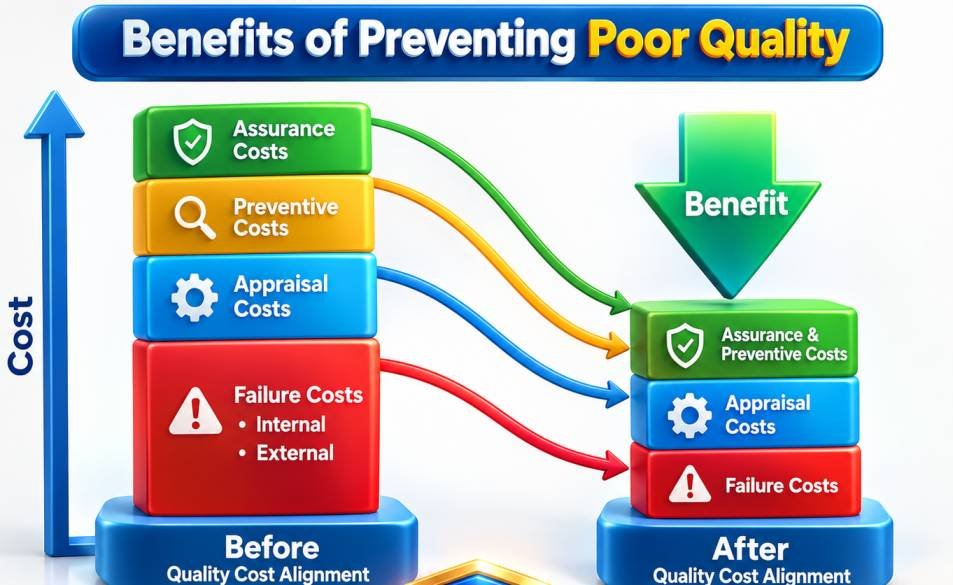
A useful way to see the impact is to compare Cost of Good Quality (COGQ) with Cost of Poor Quality (COPQ). Spending on prevention and effective appraisal can increase costs initially, but if those activities reduce recurring failures, the overall cost can fall.
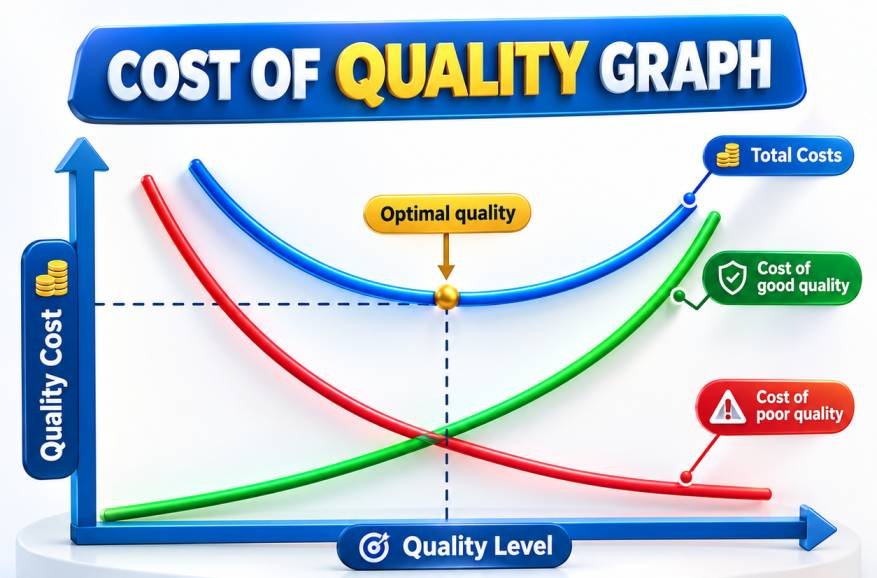
For example, in the earlier scenario, the company had:
COGQ = ₹100,000
COPQ = ₹130,000
Total COQ = ₹230,000
If targeted improvement reduces COPQ by ₹40,000 per month, the organization saves ₹480,000 annually without simply cutting necessary quality controls.
This is why I don't look at quality spending in isolation. The real question is whether the money invested in preventing problems is reducing the money lost when problems occur. When COQ is tracked alongside revenue, scrap, rework, customer failures, and improvement savings, quality becomes much easier to connect with profitability.
The goal is not to spend less on quality; it is to spend wisely enough that the cost of failures keeps falling.
How to Reduce the Cost of Poor Quality
Reducing Cost of Poor Quality (COPQ) starts with fixing the cause of the failure, not simply adding more inspection. Repeated scrap, rework, complaints, or warranty issues usually point to an underlying process problem that needs to be addressed.
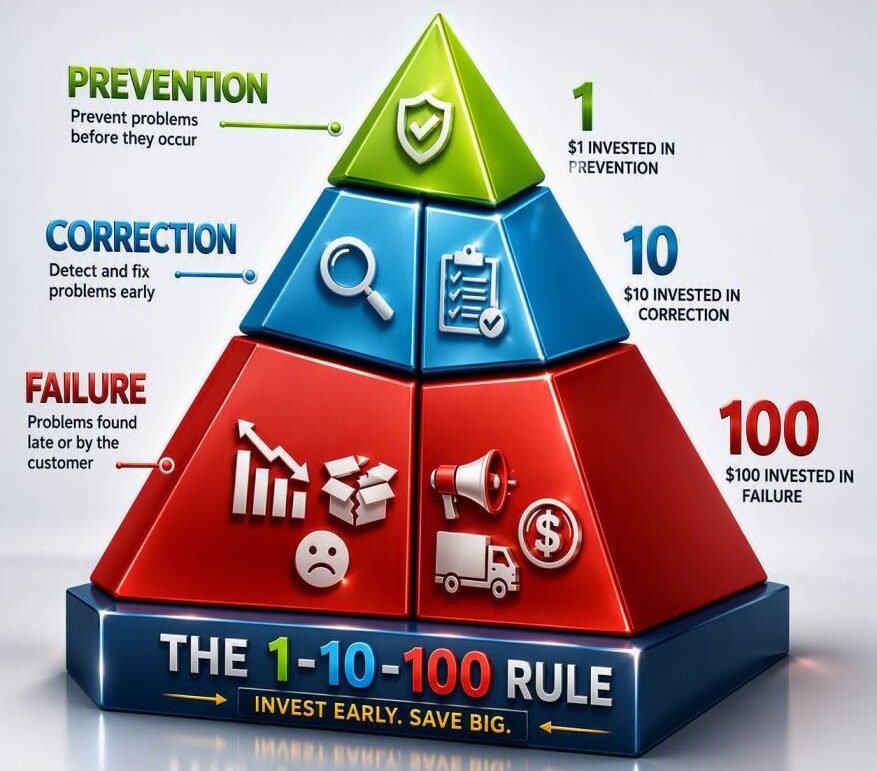
A practical approach is to focus on:
- Prevent defects early using FMEA, process capability (Cp & Cpk), Poka-Yoke, and effective process controls.
- Find the root cause of recurring problems with tools such as 5 Whys and Fishbone Analysis.
- Use data to prioritize the largest sources of scrap, rework, and customer failures rather than treating every issue equally.
- Improve the process, not just the inspection, so the problem is less likely to occur again.
- Track COPQ over time to confirm that corrective and preventive actions are actually reducing failure costs.
Once the biggest loss areas are known, it's important to understand why they are happening. Techniques such as 5 Whys, Fishbone Diagram Analysis, and Root Cause Analysis are highly effective at uncovering the underlying causes of recurring defects. I've found that organizations often treat symptoms while the real causes remain unresolved, resulting in the same problems appearing again and again.
Another powerful strategy is to improve process consistency. Many quality issues stem from excessive variation rather than isolated mistakes. This is where Process Capability (Cp & Cpk) studies, standardized work instructions, and process controls can help reduce defects before they reach the customer.
Preventive methods also play a key role. Activities such as FMEA, supplier qualification, employee training, preventive maintenance, and Poka-Yoke (Error Proofing) help identify and control risks before they turn into expensive failures. While these initiatives require investment, they are usually far less costly than managing the consequences of poor quality.
Interactive Cost of Quality (COQ) Calculator
Cost of Quality (COQ) Calculator
Enter your prevention, appraisal, and failure costs to calculate your total Cost of Quality and see it plotted on the classic COQ curve.
Cost of Quality Visible and Invisible Cost
When organizations calculate the Cost of Quality (COQ), they usually focus on visible costs such as inspections, testing, scrap, rework, warranty claims, and customer returns because these expenses are easy to measure. However, these visible costs represent only a small portion of the true financial impact of poor quality. Beneath the surface lies a much larger layer of hidden costs that quietly drain profitability, reduce productivity, and damage customer trust over time.
I often explain Cost of Quality using the iceberg analogy. The visible portion above the waterline includes costs that most companies actively track, such as prevention costs, appraisal costs, internal failures, and external failures. These costs appear in budgets, quality reports, and financial statements. What many organizations fail to recognize is that underneath the waterline sits a much larger collection of hidden expenses that rarely receive the same level of attention. These hidden costs can include lost sales opportunities, damaged reputation, customer dissatisfaction, excessive overtime, employee frustration, delayed projects, poor supplier performance, excess inventory, complaint handling, and the loss of future business. While these costs may not have a clear accounting code, they can significantly exceed the visible costs of quality issues.
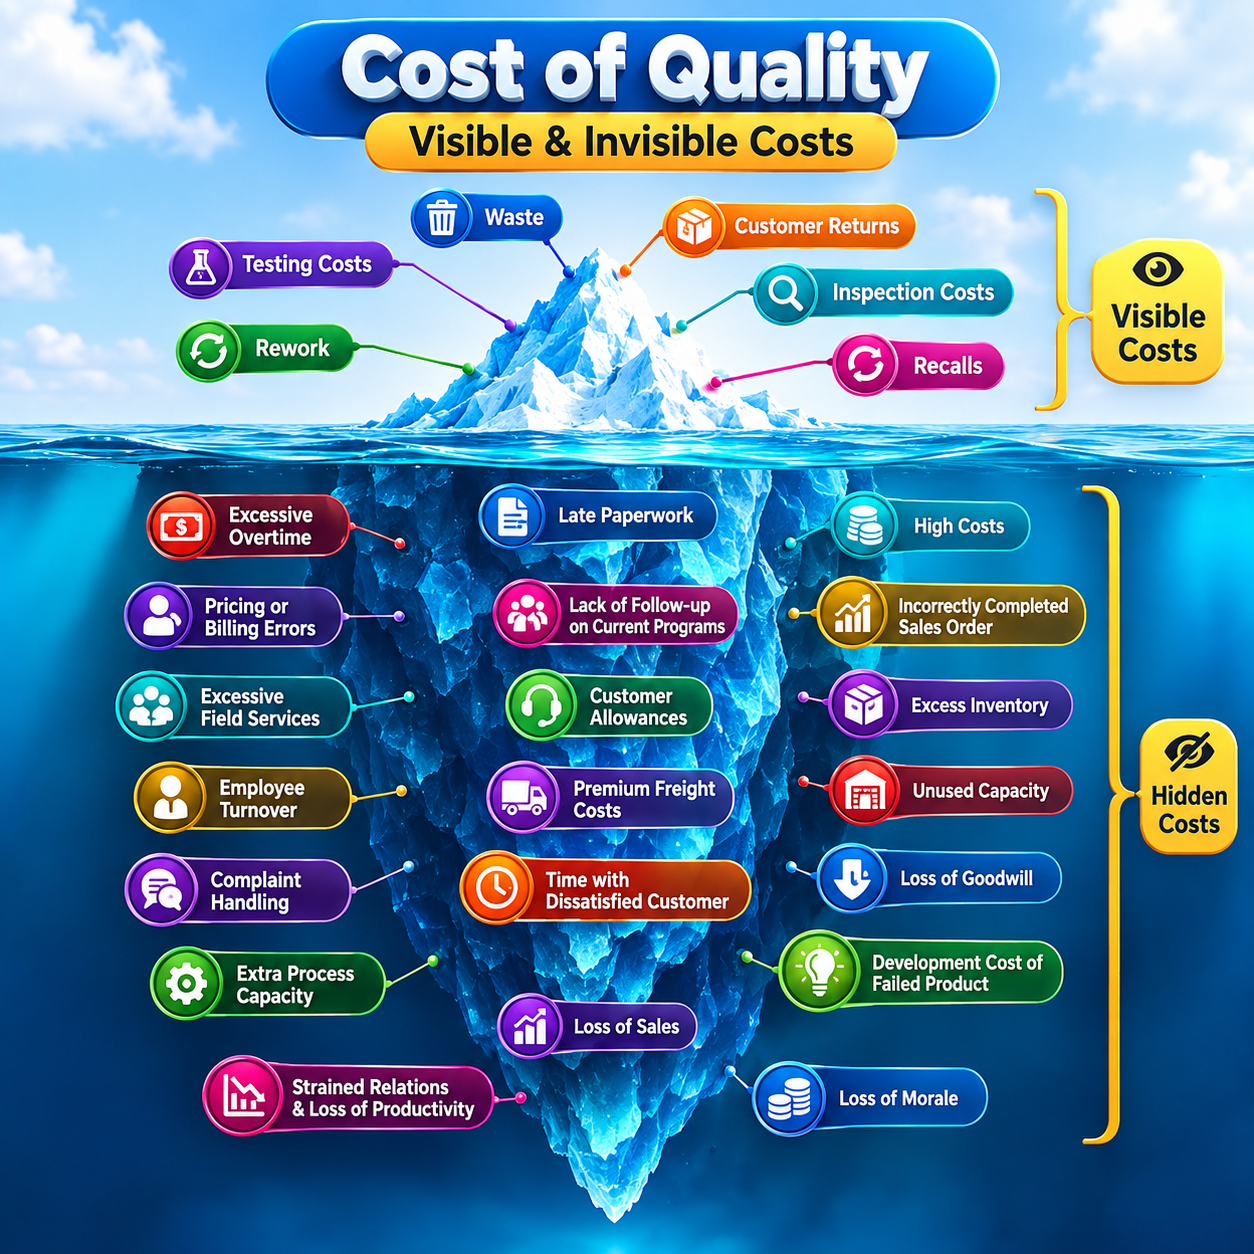
From my experience reviewing quality and risk management programs, the hidden costs are often where the greatest financial damage occurs. A defective product may result in a measurable rework cost today, but a disappointed customer may choose a competitor for years to come. That future revenue loss rarely appears in a quality dashboard, yet it can have a far greater impact on business performance than the original defect itself. Similarly, teams that spend excessive time investigating recurring problems may appear productive on paper, but the lost innovation, delayed improvements, and reduced employee morale create costs that are difficult to quantify but impossible to ignore.
Organizations that consistently outperform their competitors understand that investing in prevention is far less expensive than paying for failure. Activities such as employee training, process standardization, mistake-proofing, preventive maintenance, supplier development, and continuous improvement initiatives may initially increase the Cost of Good Quality (COGQ). However, these investments help eliminate the much larger invisible costs associated with poor quality. As prevention efforts mature, both visible and hidden failure costs decline, resulting in improved profitability, stronger customer loyalty, and a more efficient operation.
The challenge for quality professionals is to look beyond what can be easily measured. A complete Cost of Quality analysis should not stop at scrap reports or warranty expenses. It should also consider the broader business impact of quality issues, including lost customer confidence, reduced market share, employee turnover, productivity losses, and missed growth opportunities. Organizations that focus only on visible costs risk making decisions based on incomplete information, while those that understand the full iceberg of quality costs gain a significant competitive advantage.
In my view, the real value of Cost of Quality is not simply calculating numbers. It is revealing where money is silently leaking from the business. When organizations uncover both visible and invisible costs, they can make better decisions about where to invest their improvement efforts. Often, a relatively small investment in prevention can eliminate a much larger hidden cost later, transforming quality from a compliance activity into a powerful driver of business performance and long-term profitability.
Frequently Asked Questions (FAQs)
Q: What is Cost of Quality (COQ)?
COQ is the total cost of achieving required quality and dealing with quality-related failures.
Q: What are the two main categories of COQ?
COQ is divided into Cost of Conformance and Cost of Nonconformance.
Q: What is Cost of Good Quality (COGQ)?
COGQ includes Prevention and Appraisal Costs used to achieve and verify quality.
Q: What is Cost of Poor Quality (COPQ)?
COPQ includes Internal and External Failure Costs resulting from quality problems.
Q: What is the Cost of Quality formula?
COQ = Prevention + Appraisal + Internal Failure + External Failure.
Q: How is COPQ calculated?
COPQ = Internal Failure Costs + External Failure Costs.
Q: What are examples of Prevention Costs?
Training, FMEA, process improvement, and preventive maintenance are common examples.
Q: What are examples of Appraisal Costs?
Inspection, testing, audits, calibration, and verification are typical examples.
Q: What are examples of Internal Failure Costs?
Scrap, rework, repair, retesting, and quality-related downtime are common examples.
Q: What are examples of External Failure Costs?
Returns, warranty claims, complaints, repairs, and recalls are typical examples.
Q: Why is Cost of Quality important?
COQ shows where an organization is investing in quality and losing money through failures.
Q: How can COPQ be reduced?
Reduce recurring failures through prevention, root-cause analysis, process improvement, and effective process controls.

Lean Six Sigma • Six Sigma • Statistics • Project Management • Artificial Intelligence (AI) • Operations Management • Quality Management
Conclusion
Throughout my career in quality management and continuous improvement, I've found that the most successful organizations don't view quality as a department, a checklist, or a compliance requirement. They view it as a business strategy. Cost of Quality (COQ) provides a practical way to measure how much an organization is investing in quality and how much it is losing because quality requirements are not consistently met.
The concept itself is straightforward. Cost of Good Quality (COGQ) represents the investment made to prevent defects and verify performance, while Cost of Poor Quality (COPQ) represents the financial impact of failures such as scrap, rework, returns, warranty claims, and customer complaints. Together, these costs reveal where resources are being consumed and where the greatest improvement opportunities exist.
Continue Your Learning Journey
Learning is a continuous process. Explore related topics, practical guides, tools, calculators, templates, and learning resources to expand your knowledge and develop new skills.
Choose a category below to explore practical tutorials, tools, calculators, templates, case studies, and learning resources.
Recommended Learning Resources
Expert-led courses to build practical skills, earn credentials, and advance your career.
Recommended professional books, certification guides, and practical study resources.
Ready-to-use templates, checklists, guides, and workbooks for practical applications.
Interactive calculators for statistics, quality, engineering, analysis, and decision-making.
Interactive Z, t, Chi-Square, and F tables with critical values and distribution curves.
Discover practical tutorials, case studies, and professional resources across Quality, Lean Six Sigma, Project Management, Statistics, AI, and Data Analytics.
Published: September 16, 2026
Last Updated: September 18, 2026