What is Statistical Process Control (SPC): How to Monitor Process Variation and Improve Quality
Every process produces some variation. A machine may not produce exactly the same measurement every time, a filling line may deliver slightly different quantities, and even a well-established service process can produce different results from one transaction to another.The important question is not whether variation exists. It is whether the process is behaving as expected or whether something has changed.
This is where Statistical Process Control (SPC) comes in.
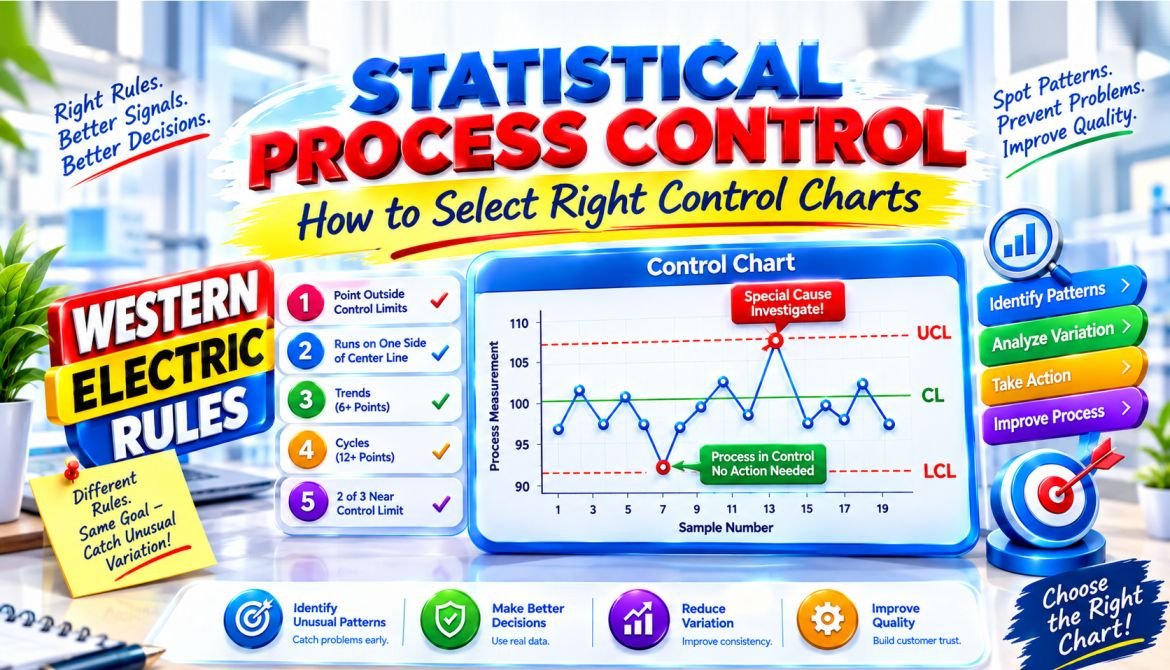
What is Statistical Process Control (SPC)
Statistical Process Control (SPC) is a data-driven approach used to monitor process performance over time and identify meaningful changes before they become larger quality problems. It helps quality professionals move beyond isolated measurements or assumptions and make decisions based on actual process data. Instead of simply asking whether a product meets a requirement, SPC encourages a broader question: What is happening within the process, and is it behaving consistently?
In everyday quality work, the value of SPC is simple: don’t wait for a defect to tell you that a process has changed. Use process data to spot potential problems early and make decisions based on evidence rather than assumptions.
SPC is used across manufacturing and many other process-driven environments. It is especially useful when consistent performance matters and data can be collected at regular intervals.
History of Statistical Process Control
The history of Statistical Process Control (SPC) began in the 1920s, when quality engineers started looking beyond final inspection and asking a more useful question: what is happening inside the process that creates the product? A major breakthrough came in 1924, when Walter A. Shewhart, while working at Bell Telephone Laboratories, developed the modern control chart. On May 16, 1924, he presented a short memorandum that included a sketch of what became the foundation of the control chart.
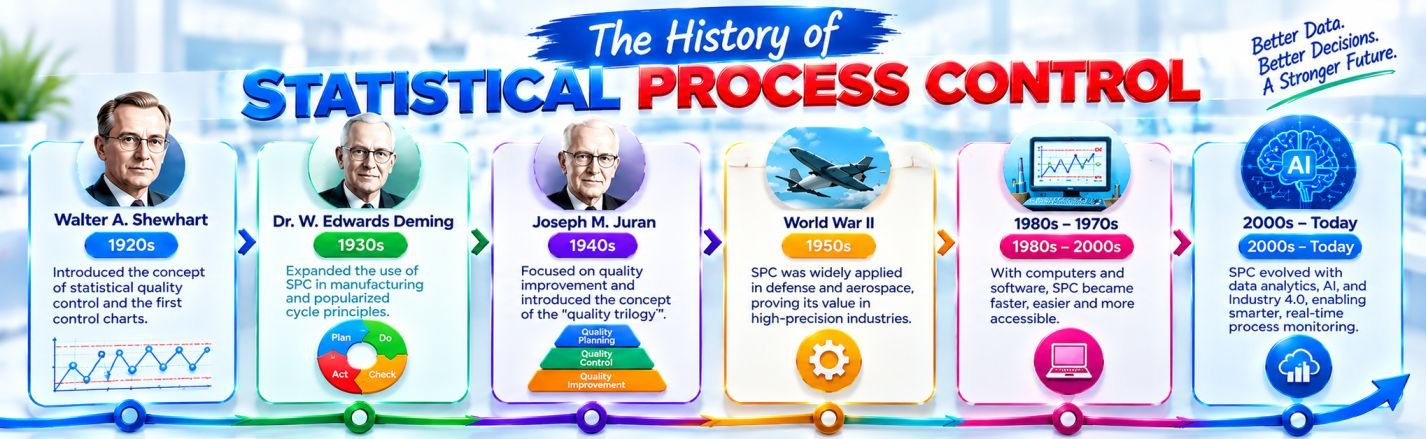
Shewhart’s work changed quality thinking. Instead of treating every difference in a measurement as a problem, he introduced a more structured way to understand process behavior and variation. His ideas became the foundation of what we now recognize as statistical process control.
In 1931, Shewhart published Economic Control of Quality of Manufactured Product. The book brought together many of his ideas on statistical quality control and became an important reference for the development of modern process-control practices.
SPC gained much wider industrial use during World War II, particularly in the United States, where control charts and statistical quality methods were used to help maintain the quality of munitions and other strategically important products produced at high volumes.
Another important part of this early history came from Harold F. Dodge and Harry G. Romig, who worked at Bell Laboratories on statistical sampling and inspection methods. Their contributions, together with Shewhart’s work, helped establish the foundations of statistical quality control.
After the war, W. Edwards Deming became one of the most influential advocates of Shewhart’s statistical approach. His work helped spread statistical quality methods in Japan and contributed to the broader development of modern quality management.
Over the decades, SPC evolved beyond its original focus on control charts. It became part of a broader approach to quality improvement, process monitoring, and managing variation, and its principles continue to be used in modern quality and process-improvement programs.
The lasting contribution of Shewhart was not simply the control chart—it was the idea of using process data to understand whether a change was meaningful before reacting to it.
🎓 Top-Rated Courses & Certifications
Try changing your filters or searching for another course.
Why is Statistical Process Control Important?
Statistical Process Control (SPC) is important because it helps organizations understand process performance before quality problems become costly. Instead of relying only on final inspection, SPC encourages teams to pay attention to what the process is doing while work is being performed.
A process can appear fine today and still be moving in the wrong direction. Small changes in output, consistency, or performance may not be obvious when individual results are reviewed separately. Monitoring process data over time gives quality teams better visibility and supports earlier, evidence-based decisions.
Understanding Process Variation: Common Cause vs Special Cause
Every process has some variation. A machine may produce slightly different dimensions from one part to the next, or a process may show small changes in cycle time, temperature, or output. The important point is understanding whether that variation is part of the normal process or something unusual has occurred.
In Statistical Process Control (SPC), process variation is generally classified into two types: common cause variation and special cause variation.
What is Common Cause Variation?
Common cause variation is the routine variation built into a process when it is operating under normal conditions. It usually comes from multiple small factors rather than one clearly identifiable event.
For example, small differences in raw materials, normal equipment behavior, environmental conditions, or measurement variation may all contribute to common cause variation. Because it is inherent to the process, simply adjusting the process whenever a small variation appears may not improve performance. In some cases, unnecessary adjustments can make a stable process less consistent.
What is Special Cause Variation?
Special cause variation comes from a specific and unusual factor that changes normal process behavior.
Examples include a tool failure, incorrect machine settings, a material problem, equipment malfunction, or an unexpected change in operating conditions. When special cause variation is suspected, the focus should be on finding and understanding the specific cause rather than reacting to the result alone.
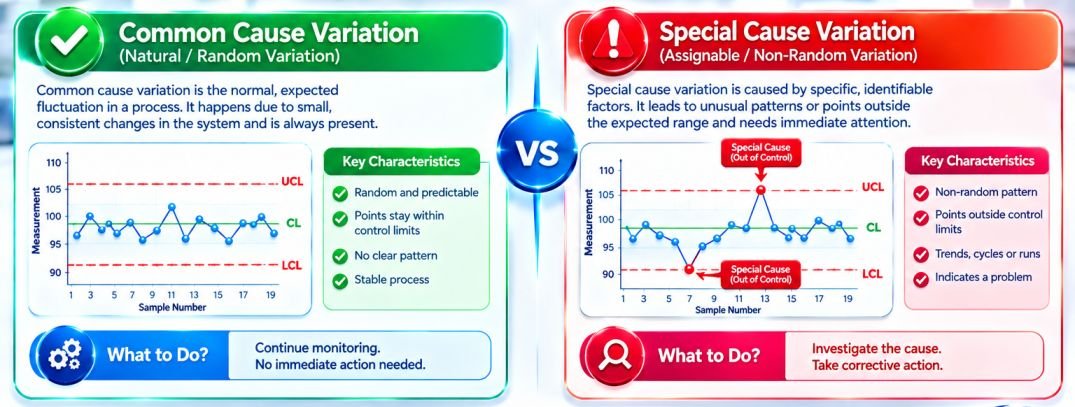
Common Cause vs Special Cause Variation
| ✅ Common Cause Variation | 🔍 Special Cause Variation |
|---|---|
| Normal process variation | Unusual process variation |
| Inherent in the process | Linked to a specific factor |
| Generally predictable | Often unexpected |
| Requires process improvement when excessive | Requires investigation and corrective action |
| Part of normal process behavior | Indicates a change in process behavior |
Why the Difference Matters
A common mistake in quality management is treating every unusual result as a special cause. Not every fluctuation means that something is wrong.
The real value of SPC is knowing when a process signal deserves investigation and when variation is simply part of normal process behavior.
In simple terms: Common cause variation is inherent in the process, while special cause variation results from an unusual factor that changes how the process behaves.
What is a Control Chart?
A control chart is one of the core tools of Statistical Process Control (SPC). It provides a simple visual way to follow process data over time and see whether the process is behaving as expected. The real value is not just in plotting data. A control chart helps you separate routine process behavior from signals that may indicate something has changed. This makes it easier for quality and process teams to decide when a process needs attention.
For example, if you’re monitoring the diameter of a manufactured part, plotting measurements in the order they are collected can reveal changes that may not be obvious when looking at individual readings. A developing shift or unusual pattern can be much easier to recognize visually. Control charts are therefore useful for ongoing process monitoring, particularly when consistency and early detection matter.
In simple terms: A control chart is a visual SPC tool that shows how a process behaves over time and helps identify when that behavior changes.
Components of a Control Chart
A control chart becomes much easier to read once you understand its three main reference lines: the Center Line (CL), Upper Control Limit (UCL), and Lower Control Limit (LCL). These lines provide the framework for judging how process data is behaving over time.
Center Line (CL)
The Center Line (CL) represents the central tendency of the process being monitored, commonly its average. It acts as the reference point for the data plotted on the chart. For example, if a process has an average measured value of 25.00 mm, the center line would be positioned at 25.00 mm.
Upper Control Limit (UCL)
The Upper Control Limit (UCL) is the upper statistical boundary established from process data. It indicates how far the process measurement would normally be expected to vary under the conditions used to calculate the chart.
A point above the UCL is a signal worth investigating because it may indicate that something has changed in the process.
Lower Control Limit (LCL)
The Lower Control Limit (LCL) is the corresponding lower statistical boundary. A point below the LCL may also signal an unusual change that deserves investigation.
Control Limits vs Specification Limits
Control limits and specification limits are not the same thing, even though both are often shown around process data.
The easiest way to remember the difference is this: Control limits describe what the process is doing. Specification limits describe what the process is required to produce.
Control Limits
Control limits are calculated from process data and are used to understand whether the process is behaving consistently over time. They are typically shown as the Upper Control Limit (UCL) and Lower Control Limit (LCL) on an SPC control chart.
Their purpose is to help answer: Is the process behaving as expected?
A process signal outside the control limits can indicate that something unusual has affected the process and may warrant investigation.
Specification Limits
Specification limits come from requirements such as product design, customer expectations, engineering criteria, or applicable standards. They are usually expressed as: USL — Upper Specification Limit & LSL — Lower Specification Limit
They answer a different question: Does the output meet the required specification?
| 📈 Control Limits | 📋 Specification Limits |
|---|---|
| Calculated from process data | Defined by requirements |
| Describe process behavior | Define acceptable output |
| Used to assess process stability | Used to assess conformity |
| Usually UCL and LCL | Usually USL and LSL |
📚 Recommended Books for Professionals
Try removing one or more filters.
Types of SPC Control Charts
Different types of Statistical Process Control (SPC) charts are used depending on the type of data being collected and the characteristics being monitored. There is no single SPC control chart that fits every process. The right chart depends on the kind of data being collected. At a broad level, Statistical Process Control (SPC) charts are divided into two main groups: variable control charts for measured data and attribute control charts for count-based or classified data.
Advanced SPC Control Charts
Beyond the commonly used charts, SPC also includes more specialized methods such as CUSUM (Cumulative Sum) and EWMA (Exponentially Weighted Moving Average) charts. These methods are particularly useful when the monitoring objective requires greater sensitivity to certain changes in process behavior.
In simple terms: Variable control charts are used for measured characteristics, while attribute control charts are used for defectives, defects, and other count-based data.
How to Select the Right Control Chart
Choosing the right SPC control chart starts with the data, not the process name. A chart that works well for measured dimensions may be completely inappropriate for defect counts. The easiest starting point is to ask: Are you measuring something, or counting something?
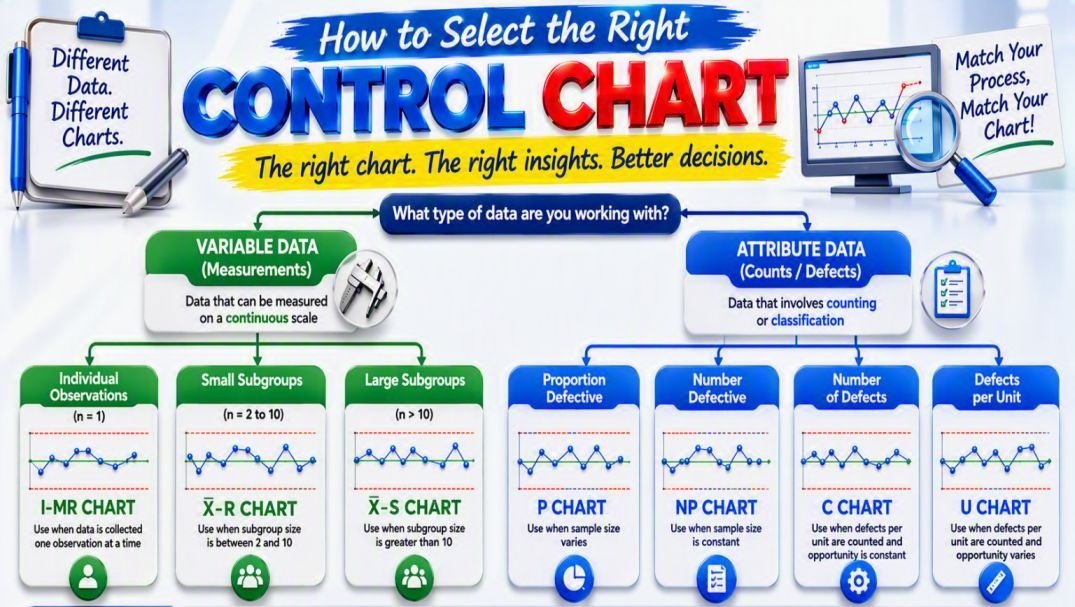
1. Start With the Data Type
Variable data consists of measurable values such as diameter, weight, temperature, pressure, or cycle time.
Attribute data describes counts or classifications, such as defective units, defects, or the percentage of rejected products.
2. Match the Data to the Chart
The key is to understand how the data is structured and collected. Sample size, subgrouping, and whether you are measuring defects or defectives can all affect the appropriate chart choice.
A Simple Way to Remember : Measuring → Variable Control Chart or Counting → Attribute Control Chart
Once you've identified the data type, the next step is matching the sampling structure to the appropriate chart.
How to Calculate SPC Control Limits
SPC control limits are calculated from process data to establish the statistical boundaries of normal process behavior. Unlike specification limits, they come from the process itself rather than from customer or engineering requirements.
For a basic understanding, control limits are often expressed using the 3-sigma approach:
Here, UCL is the Upper Control Limit, LCL is the Lower Control Limit, and σ represents the estimated process variation.
How to Interpret Control Charts
A control chart helps you judge whether a process is behaving consistently over time. The key is to look at the overall behavior of the data, not just whether an individual point falls inside the control limits. A process may still show a meaningful signal even when every point remains between the UCL and LCL. Conversely, one unusual observation should be investigated in context rather than automatically treated as proof that the entire process is out of control.
Start with the question: Does the data look random and consistent, or does it show a pattern?
If the points appear reasonably random around the center line with no unusual signals, the process may be behaving predictably. When a clear signal appears, the next step is to investigate what changed rather than simply adjusting the process.
This is an important quality-engineering principle: a control chart tells you that something may be happening; it does not tell you the root cause by itself.
Nelson Rules (and Western Electric Rules) for Control Charts
While a point outside the control limits is a clear signal that a process may be out of control, many process changes occur before a point actually crosses the Upper Control Limit (UCL) or Lower Control Limit (LCL). To detect these early warning signs, quality professionals use Nelson Rules and Western Electric Rules.
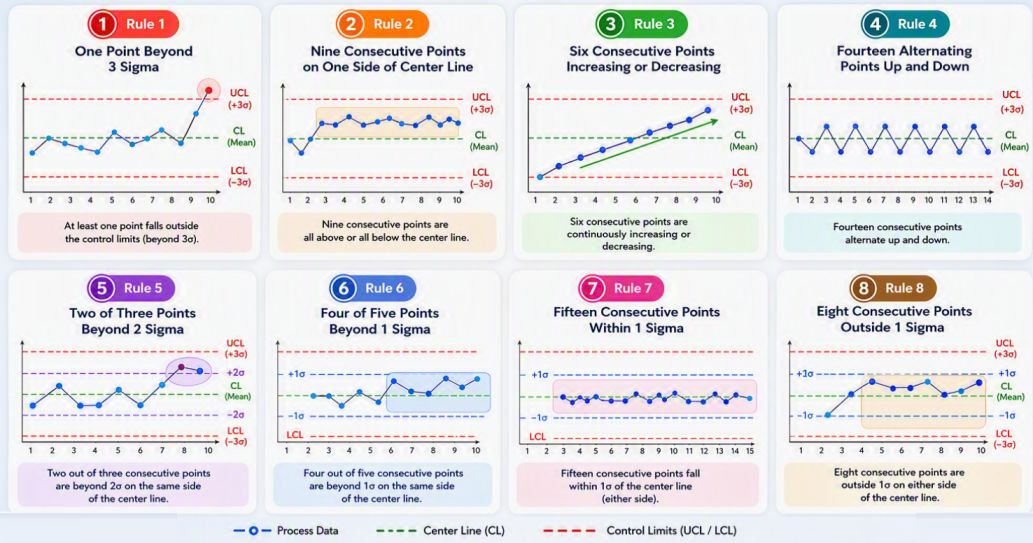
These rules help identify non-random patterns in control charts that may indicate special cause variation, even when all points remain within the control limits.
Benefits of Statistical Process Control
Frequently Asked Questions (FAQs)
Q: What is Statistical Process Control (SPC)?
A: SPC is a data-driven method used to monitor process performance and identify unusual variation before it leads to quality problems.
Q: What is the main purpose of SPC?
A: The main purpose of SPC is to improve process stability, consistency, and predictability by monitoring variation over time.
Q: What is a control chart?
A: A control chart is a graphical SPC tool that tracks process data over time and helps identify unusual process behavior.
Q: What are control limits in SPC?
A: Control limits are statistically calculated boundaries that represent the expected variation of a process under normal conditions.
Q: What is the difference between control limits and specification limits?
A: Control limits describe how a process behaves, while specification limits define the acceptable requirements for the product or process.
Q: What are common cause and special cause variation?
A: Common cause variation is inherent to the process, while special cause variation results from an identifiable and unusual factor.
Q: Which control chart should I use?
A: The right chart depends on your data. X̄-R, X̄-S, and I-MR charts are commonly used for measurements, while P, NP, C, and U charts are used for attribute data.
Q: What do Nelson Rules help identify?
A: Nelson Rules help identify non-random patterns in control charts that may indicate process shifts, trends, or other unusual behavior.
Q: Can a process be stable but still produce defects?
A: Yes. A stable process can consistently produce results outside customer specifications if its natural variation is too large or its average is poorly centered.
Q: Is SPC only used in manufacturing?
A: No. SPC is also applied in healthcare, pharmaceuticals, laboratories, logistics, finance, software, and other service processes.
Conclusion
Statistical Process Control (SPC) is not simply a set of control charts, formulas, or statistical rules. At its core, it is a practical way to understand how a process behaves and make better decisions using real data. The biggest value of SPC is its preventive mindset. Instead of waiting for defects to appear and then reacting, teams can recognize meaningful changes in process behavior early and respond before a small issue becomes a larger quality problem.
From my experience in quality engineering, SPC delivers the most value when it is treated as part of everyday process thinking, rather than just a quality-reporting or audit requirement. A properly interpreted control chart can provide an early indication that something is changing before the problem becomes visible through defects or customer complaints.
SPC also fits naturally into broader Lean, Six Sigma, and continuous improvement efforts because it provides objective evidence of whether a process is actually improving and remaining stable.
Ultimately, the goal is straightforward: use process data to build stable, predictable processes that consistently deliver the quality customers expect.

Lean Six Sigma • Six Sigma • Statistics • Project Management • Artificial Intelligence (AI) • Operations Management • Quality Management
Continue Your Learning Journey
Learning is a continuous process. Explore related topics, practical guides, tools, calculators, templates, and learning resources to expand your knowledge and develop new skills.
Choose a category below to explore practical tutorials, tools, calculators, templates, case studies, and learning resources.
Recommended Learning Resources
Expert-led courses to build practical skills, earn credentials, and advance your career.
Recommended professional books, certification guides, and practical study resources.
Ready-to-use templates, checklists, guides, and workbooks for practical applications.
Interactive calculators for statistics, quality, engineering, analysis, and decision-making.
Interactive Z, t, Chi-Square, and F tables with critical values and distribution curves.
Discover practical tutorials, case studies, and professional resources across Quality, Lean Six Sigma, Project Management, Statistics, AI, and Data Analytics.
Published: September 14, 2026
Last Updated: September 18, 2026