What is Rolled Throughput Yield (RTY) , First Pass Yield (FPY) & First Time Yield (FTY) Formula, Calculator & Examples
Imagine you are managing a manufacturing line. Every department proudly reports a 95% success rate. Everything seems excellent — until you realize that customers are still complaining, costs are rising, and rework is eating away your productivity.
Sounds familiar ?
A process can look excellent at each individual step and still perform poorly when the entire flow is measured from start to finish. This is where Rolled Throughput Yield (RTY) becomes powerful. For example, if a product passes through several process steps and each step has a 99% First Pass Yield, many teams assume the overall process is almost perfect. But in real manufacturing and quality systems, small losses at each stage add up quickly. A process with 10 steps at 99% yield each has an overall RTY of only about 90.4%. That means nearly 1 in 10 units may require rework, repair, or correction before reaching the customer.
This is one of the most common traps in process improvement. On paper, everything looks efficient. But in reality, defects occur at multiple stages, get repaired, and quietly inflate your performance numbers. This is where Rolled Throughput Yield (RTY) becomes a powerful truth-teller.
In this guide, you will learn what Rolled Throughput Yield (RTY) means, how to calculate it using the RTY formula, how it differs from First Pass Yield (FPY), and how to apply it using practical examples, a free calculator, and an Excel template.
What is Rolled Throughput Yield (RTY) ?
Before understanding Rolled Throughput Yield (RTY), it’s important to first understand the concepts of Yield and Throughput Yield (TPY). These metrics provide the foundation for measuring process performance, but they don’t always reveal how efficiently an entire process operates from start to finish. This is one of the most common areas of confusion I have encountered while working on manufacturing process improvement projects. Many teams monitor the yield of individual operations, yet struggle to determine the true performance of the complete production process.
Rolled Throughput Yield (RTY) is the probability that a product or service passes through an entire process without any defects or rework. It is a process performance metric that measures the probability of a product, service, or transaction successfully completing every step of a process without defects, rework, repairs, or corrections. Unlike metrics that evaluate individual operations, RTY measures the performance of the entire process, providing a realistic view of how often the final output is produced correctly the first time.
I’ve learned while working on quality improvement projects is that high-performing individual processes don’t always translate into a high-performing overall process. I have reviewed production lines where each manufacturing stage consistently achieved its quality target, making the process appear highly capable. However, once the entire workflow was analyzed using RTY, the results told a different story. Small losses at each stage had accumulated over the complete process, resulting in significantly more rework and lower overall efficiency than the individual metrics suggested. That experience reinforced why RTY is one of the most valuable indicators of true process performance.
Consider a product that passes through five sequential operations, each achieving a 99% First Pass Yield (FPY). Although every step appears highly efficient, the overall Rolled Throughput Yield is only about 95.1%. In other words, nearly 1 in every 20 products will require rework or fail to meet quality requirements before reaching the customer. RTY captures this cumulative effect, helping organizations uncover hidden process losses that are often overlooked when evaluating each operation independently.
In simple words: RTY tells you how many units are perfect from start to finish — the first time.
In my experience with process improvement and quality projects, teams often focus heavily on individual process yields because those numbers look good on paper. But once the complete value stream is reviewed using RTY, the real performance gap becomes much clearer. That is why RTY is one of the most practical metrics for identifying hidden defects, reducing rework, improving productivity, and strengthening overall process capability. Let’s break that down.
🎓 Top-Rated Courses & Certifications
Try changing your filters or searching for another course.
What is Yield
Yield, also commonly referred to as First Time Yield, represents the percentage of non-defective items out of the total items produced in a process. In simple terms, it answers a very basic question:
Out of everything we produced, how many units were good without any defects?
I have seen in many manufacturing and quality improvement projects, teams sometimes celebrate a high yield percentage only to discover later that substantial effort was spent fixing defective units before they reached the customer. The final result looks good, but the hidden cost of achieving that result is often overlooked. Understanding the different types of yield helps uncover these hidden losses and provides a much clearer picture of true process performance.
First Time Yield (FTY)
First Time Yield (FTY) measures the percentage of units that successfully complete a process and emerge as acceptable output. It compares the number of good units produced with the total number of units entering the process.
At first glance, this seems like a reasonable measure of performance. However, FTY does not always reveal what happened inside the process. If a defective unit is repaired, adjusted, retested, and eventually passes inspection, it may still be counted as acceptable output. As a result, an operation can report a strong FTY while quietly absorbing additional labor, delays, and quality costs.
Example : Suppose a process produces 100 units.
- Total units entering the process = 100
- Good units produced = 85
- Defective units = 15
The First Time Yield is: FTY = 85 ÷ 100 × 100 = 85%.
This means that 85% of the units met requirements, while 15% failed to meet specifications.
In simple words, FTY considers:
- What goes into the process as input
- What comes out of the process as output
However, it does not take into account any rework or correction activities that may have occurred during the process. Even if a defective unit is repaired and finally delivered as a good unit, FTY will still count it as acceptable output. This is where many organizations get misled — because the numbers look good on paper, but in reality, the process may be inefficient due to hidden rework, delays, and added costs.
In one manufacturing improvement project, I remember a production line proudly reporting an FTY above 90%. At first glance, the numbers looked healthy and management believed the process was performing well. However, after spending time on the shop floor, we discovered operators were routinely correcting minor defects before the final inspection. The finished product was acceptable, but additional labor, time, and resources were being consumed every day. That experience taught me that a good FTY number should always be supported by an understanding of what is happening inside the process.
Throughput Yield (TPY)
To overcome this limitation, we use Throughput Yield (TPY). TPY focuses on the probability that a unit passes a particular process step without any defects or rework. ITPY measures the probability that a unit successfully passes a specific process step without requiring any rework, repair, correction, adjustment, or retesting. Rather than focusing only on final output, TPY evaluates how effectively the process performs correctly the first time.
A simple way to think about TPY is:
What is the likelihood that a unit will pass this process step perfectly on its first attempt?
Example : Let’s consider a simple assembly process.
- Units entering the process = 100
- Units that pass the process on the first attempt = 92
- Units requiring rework = 8
Although all 100 units may eventually be shipped after rework, TPY focuses only on units that pass correctly the first time. Therefore:
TPY = First-Pass Good Units ÷ Total Units Entering the Process
TPY = 92 ÷ 100 = 92%
This means there is a 92% probability that a unit will pass this process step without requiring any rework, repair, adjustment, or correction.
One of the reasons I prefer using TPY during process improvement workshops is that it often reveals losses that basic yield calculations fail to capture. In a medical device assembly process, a station appeared stable because most units eventually passed inspection. However, when we measured TPY, we discovered many units required adjustments before moving to the next operation. The process was technically producing acceptable output, but it was not achieving that output correctly the first time. That insight helped the team focus on root causes instead of merely managing the symptoms through rework.
Rolled Throughput yield (RTY)
While TPY evaluates individual process steps, Rolled Throughput Yield (RTY) evaluates the performance of the entire process from start to finish. RTY measures the probability that a product, service, or transaction successfully passes through every process step without defects, rework, repair, correction, or scrap. It provides a true end-to-end view of process effectiveness rather than focusing on isolated operations.
Example : Let’s consider a simple manufacturing process with three sequential process steps:
Since a product must successfully pass through all three steps, the overall RTY is calculated by multiplying the individual TPYs
Step 1: Convert percentages to decimals
- TPY₁ = 96% = 0.96
- TPY₂ = 97% = 0.97
- TPY₃ = 98% = 0.98
Step 2: Calculate RTY
=> RTY = 0.96 × 0.97 × 0.98
=>RTY = 0.9126 = 91.26%
Although every process step appears to be performing extremely well, the overall process has only a 91.26% probability of producing a defect-free unit from start to finish. In other words, out of every 1,000 units entering the process:
Good units = 1000 × 91.26%= 913
Approximately 913 units are expected to pass through all three process steps without defects, rework, repair, or correction, while 87 units will experience some form of loss within the process.
One reason RTY is so valuable is that small losses accumulate quickly as products move through multiple process steps. A process can show excellent results at individual stations and still have a much lower overall success rate than expected. In practical Lean Six Sigma projects, RTY is often the metric that generates the biggest surprise. I have worked with teams where every department reported strong yields, yet RTY revealed substantial hidden losses across the overall value stream. Once those losses became visible, improvement opportunities that had gone unnoticed for years suddenly became obvious.
Simply put:
- FTY tells us how many good units were produced.
- TPY (FPY) tells us how often a process step gets it right the first time.
- RTY tells us the probability of achieving a defect-free outcome across the entire process.
Because RTY captures the cumulative effect of all process losses, it is widely used in Lean Manufacturing, Six Sigma, Medical Device Manufacturing, Automotive, Aerospace, Electronics, and Operational Excellence initiatives to identify hidden factory losses and drive meaningful process improvements.
📚 Recommended Books for Professionals
Try removing one or more filters.
How to Calculate Rolled Throughput Yield (RTY) : 3 Common Process Configurations
In real-world manufacturing and service environments, processes are not always arranged in the same way. Some operations follow a simple step-by-step sequence, others run simultaneously, and many contain a mix of both. The approach used to calculate Rolled Throughput Yield (RTY) depends on how the process is structured.
One common method is to calculate the Throughput Yield (TPY) for each process step and then combine them based on the process flow. When defect data is available, TPY can be calculated using:
RTY = e-DPU
Where: DPU = Defects Per Unit
e = 2.71828
DPU = Defect per Units.
Once the TPY for each process is known, RTY can be calculated for one of the following three process configurations:
Case 1: Process are arranged in Series
The most common process configuration in manufacturing is a series process, where the output of one operation becomes the input to the next operation.
Let assume the Process A, B and C operates in series. 10 Parts enter Process A, 2 are rejected and only 8 parts are good. These 8 parts enter Process B, 1is rejected and only 7 parts are good. Now these 7 parts enter Process C, 1is rejected and only 6 parts are good. Lets calculate the TPY for each process in series:
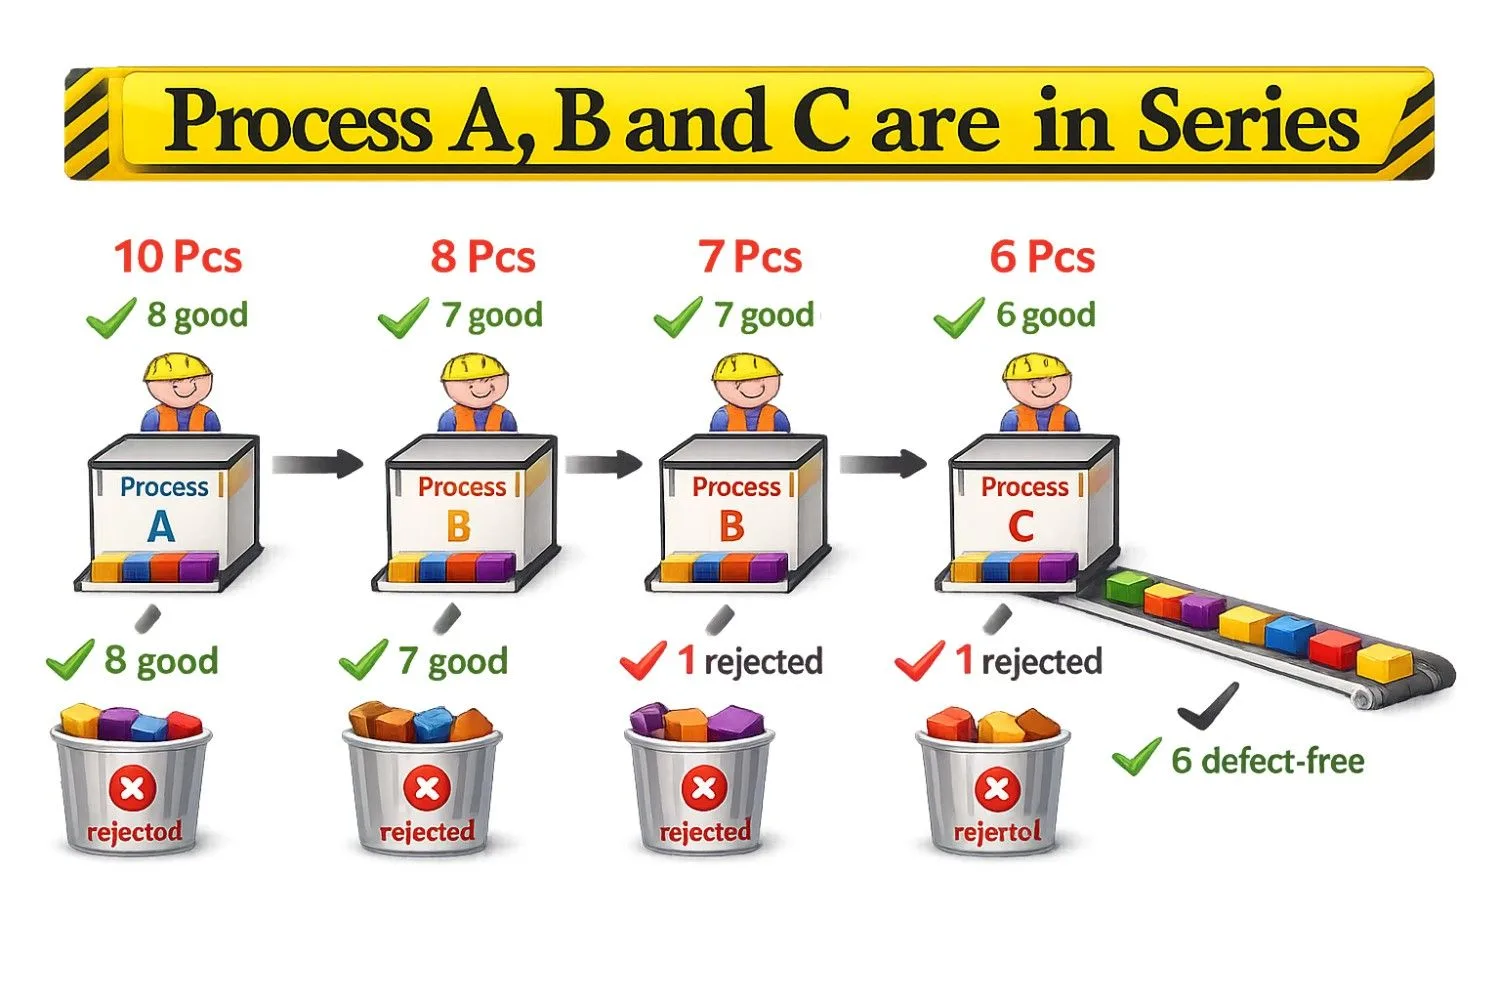
TPY (Process A)= e-DPU TPY (Process B)= e-DPU TPY (Process C)= e-DPU
DPUA = 2/10= 0.2 DPUB = 1/8= 0.2 DPUc = 1/7 = 0.1
DPUA = 0.2 DPUB = 0.125 DPUC = 0.142
TPY A= e-0.2 TPY B = e-0.125 TPY C = e-0.142
TPY A= 0.8187 TPY B = 0.8824 TPY C = 0.8676
RTY = Process ATPY * Process BTPY * Process CTPY
RTY = 0.8187* 0.8824* 0.8676
RTY (Series) = 0.626
Case 2: Process are arranged in Parallel.
Not all processes operate in a step-by-step sequence. In many manufacturing environments, multiple machines, production lines, inspection stations, or operators perform the same activity simultaneously. These are known as parallel processes.
Let assume the Process D, E and F operates in parallel. 10 Parts enter Process A, 2 are rejected and only 8 parts are good. 10 Parts enter Process B, 3 are rejected and only 7 parts are good. 10 Parts enter Process C, 1 are rejected and only 9 parts are good. Lets calculate the TPY for each process in Parallel:
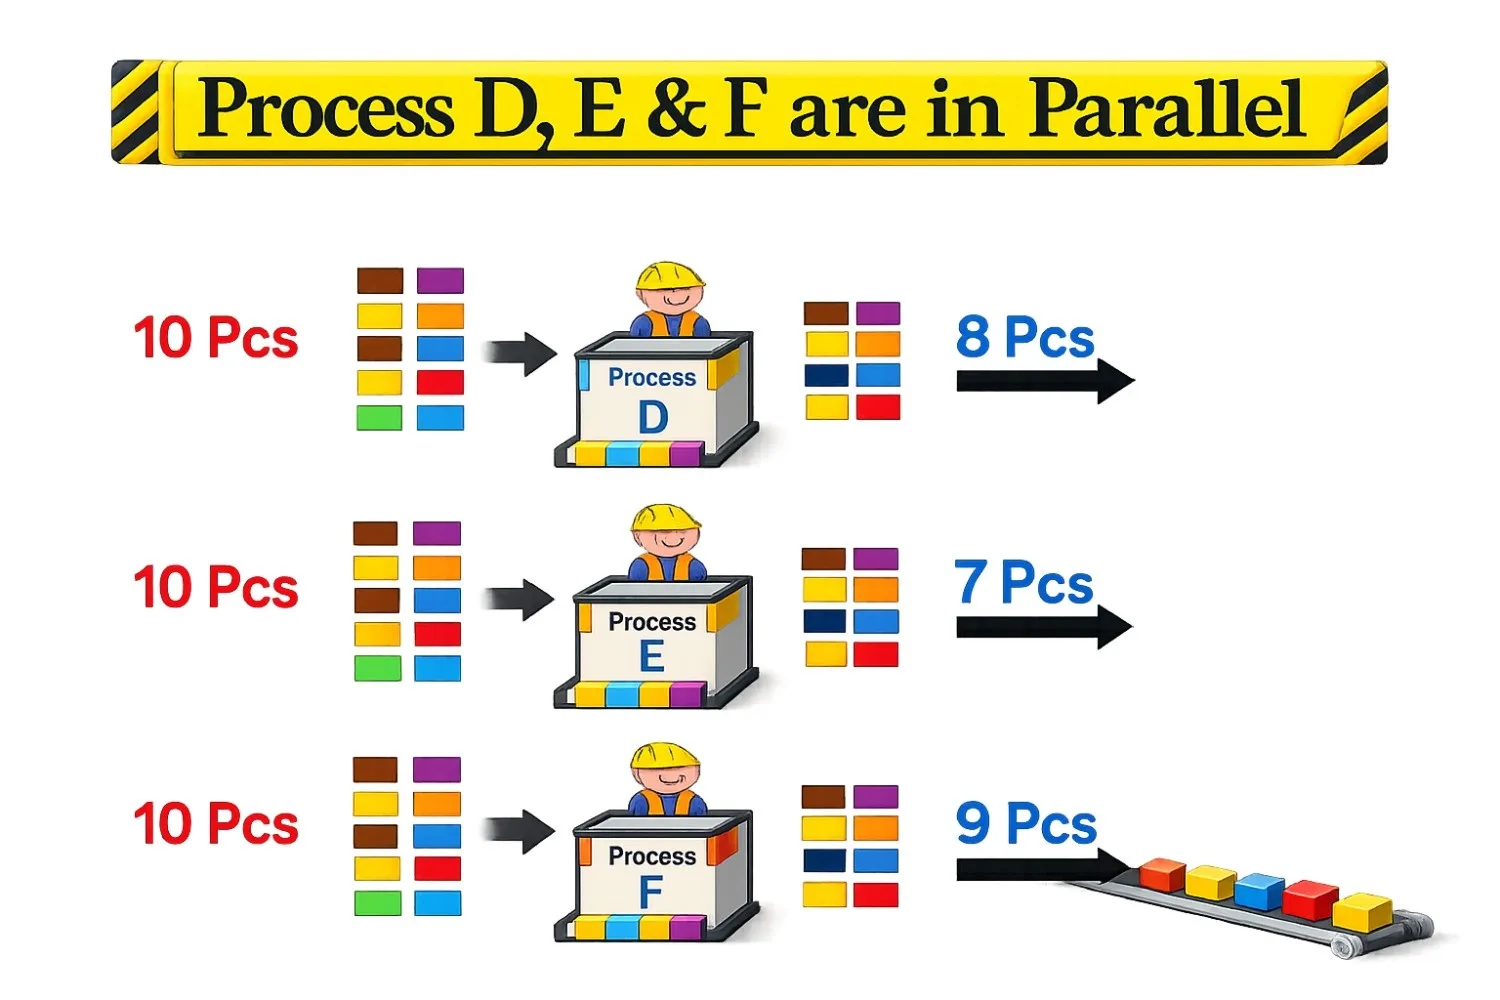
TPY (Process D)= e-DPU TPY (Process E)= e-DPU TPY (Process F)= e-DPU
DPUD = 2/10= 0.2 DPUE = 3/10= 0.3 DPUF = 1/10 = 0.1
DPUD = 0.2 DPUE = 0.3 DPUF = 0.1
TPY D= e-0.2 TPY E = e-0.3 TPY F = e-0.1
TPY D= .8187 TPY E = .7408 TPY F = .9048
RTY = Minimum of ( Process DTPY OR Process ETPY OR Process FTPY
RTY = 0.8187* 0.7408* 0.9048
RTY (Parallel) = 0.5487
Case 3: Process are arranged in combination of Series and Parallel.
In real-world manufacturing and service environments, processes are rarely arranged entirely in series or entirely in parallel. Most production systems contain a combination of both. This makes RTY especially valuable because it helps quantify the cumulative impact of defects across a more realistic process flow.
Let assume the Process A, B operates in Parallel and C in series . 10 Parts enter Process A, 2 are rejected and only 8 parts are good. 10 Parts enter Process B, 3 are rejected and only 7 parts are good. These two process A and B are in Parallel. so we will first calculate the TPY for each process and later Process AB and Process C are in Series.
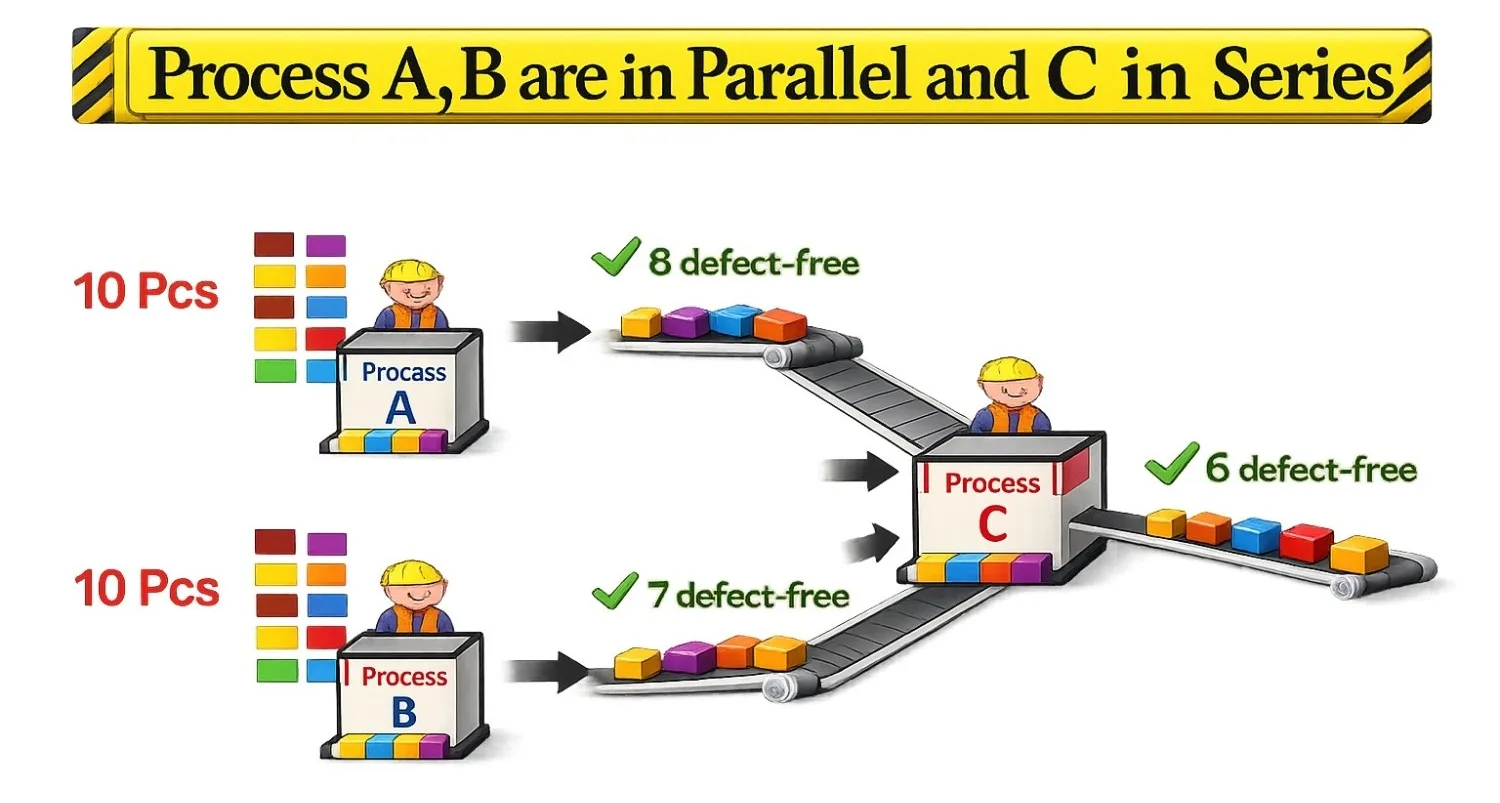
TPY (Process A)= e-DPU TPY (Process B)= e-DPU
DPUA = 2/10= 0.2 DPUB = 3/10= 0.3
DPUA = 0.2 DPUB= 0.3
TPY A= e-0.2 TPY B = e-0.3
TPY A= .8187 TPY B = .7408
RTY ( AB ) = Minimum of ( Process ATPY OR Process BTPY )
RTY ( AB ) = 0.8187 OR 0.7408
RTY ( AB ) = 0.7408
Now Process C is in Series with both Process A and Process B
Lets first calculate : TPY (Process C)= e-DPU =
DPUC = 1/7 = 0.1428
TPY (Process C)= e-DPU = e-0.1428 =.8669
TPY (Process C) =0.8689
RTY (Total) = RTY( AB ) * TPY (Process C)= e-DPU
RTY (Total) = 0.7408 * 0.8689
RTY (Total) = 0.6422
📊Digital E-Learning: Rolled Throughput Yield (RTY) Calculator
Use this interactive RTY Calculator to measure the probability of producing a defect-free product across multiple process steps. Simply enter the number of units and defects for each operation to instantly calculate Throughput Yield (TPY), Rolled Throughput Yield (RTY), Hidden Factory Loss, and estimated Sigma Level. This tool is ideal for Lean Manufacturing, Six Sigma, Quality Engineering, Medical Device, Automotive, and Operational Excellence projects.
📊Calculator: Rolled Throughput Yield (RTY)
This Rolled Throughput Yield calculator measures the probability that a product, service, or transaction will pass through every process step without defects, rework, repair, or scrap. It is especially useful for manufacturing, healthcare, service, logistics, and Lean Six Sigma improvement projects where final inspection alone may hide the true cost of poor quality.
Add each process station. For every step, enter the units entering the station and the number of defects, scrap, rework, or corrections.
Key outputs are displayed in large KPI cards using quality-focused color coding.
Primary metric showing true end-to-end first-pass yield.
Estimated units passing through all steps without rework.
Cumulative loss caused by scrap, repair, and correction.
Approximate long-term sigma level based on RTY.
Highest first-pass yield among all stations.
Average station-level first-pass yield.
Estimated hidden factory loss units from starting quantity.
Number of valid process stations included.
Frequently Asked Questions (FAQ)
- What is Rolled Throughput Yield (RTY)?
Rolled Throughput Yield (RTY) measures the probability of a product passing every process step without defects or rework, providing a true measure of overall process performance. - How do you calculate Rolled Throughput Yield (RTY)?
Calculate RTY by multiplying the Throughput Yield (TPY) of each process step. The result represents the probability of producing a defect-free product on the first attempt. - What is the formula for Rolled Throughput Yield?
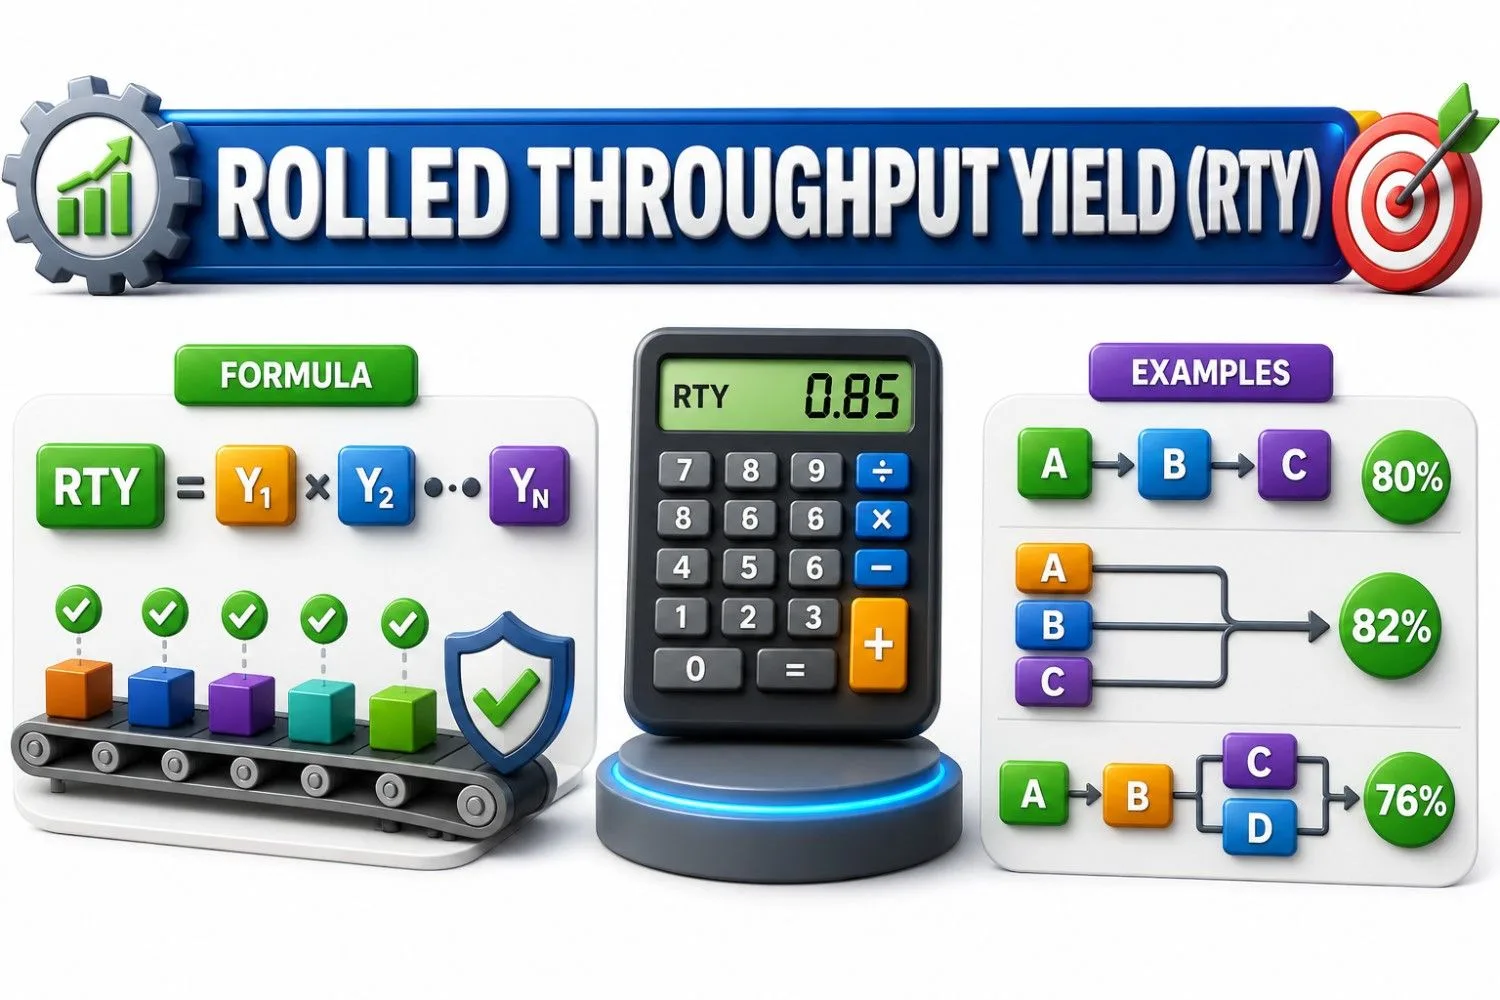
The RTY formula is RTY = TPY₁ × TPY₂ × TPY₃ × … × TPYₙ, where each TPY is the first-pass yield of an individual process step. - What is the difference between First Pass Yield (FPY) and Rolled Throughput Yield (RTY)?
FPY measures the first-pass success of a single process, while RTY measures the cumulative first-pass success across the entire process. - What is the difference between Throughput Yield (TPY) and Rolled Throughput Yield (RTY)?
TPY evaluates the defect-free performance of one process step, whereas RTY combines the TPY of all process steps to measure overall process effectiveness. - Why is Rolled Throughput Yield important in Six Sigma?
RTY reveals hidden losses caused by defects and rework across multiple process steps, helping Six Sigma teams prioritize improvements that maximize overall process performance. - Why can a 99% efficient process still have a lower RTY?
Each process step introduces another chance for defects. As these small losses accumulate, the overall RTY becomes lower than the yield of any individual process. - What is considered a good Rolled Throughput Yield?
A higher RTY indicates a more capable and efficient process. The target value depends on the industry, product complexity, and customer quality requirements. - Can Rolled Throughput Yield exceed 100%?
No. RTY is a probability and always ranges from 0% to 100%, with 100% indicating every product passed every process step without rework. - Which industries use Rolled Throughput Yield?
RTY is widely used in manufacturing, medical devices, automotive, aerospace, electronics, pharmaceuticals, healthcare, and service industries. - Does Rolled Throughput Yield include rework?
No. RTY counts only products that pass every process step correctly on the first attempt, so any rework or repair reduces the RTY. - What are the benefits of improving RTY?
Improving RTY reduces defects, rework, production costs, and cycle time while increasing productivity, quality, and customer satisfaction. - Is Rolled Throughput Yield the same as Overall Yield?
No. Overall Yield includes products accepted after rework, whereas RTY measures only products completed defect-free on the first pass. - How can I improve Rolled Throughput Yield?
Improve RTY by reducing process variation, eliminating root causes of defects, standardizing work, implementing mistake-proofing, and applying Lean Six Sigma tools. - Can I calculate Rolled Throughput Yield in Excel?
Yes. RTY can be calculated by multiplying the TPY of each process step, and an Excel template can automate the calculation for multi-step processes.
Benefits of calculating rolled throughput yield
Calculating Rolled Throughput Yield (RTY) offers several benefits, particularly in process improvement and quality management. Some of the key advantages include:
- Comprehensive view of process quality: RTY considers the cumulative effect of defects across multiple stages or steps in a process. It provides a more realistic and comprehensive assessment of process quality compared to single-stage metrics like First Pass Yield (FPY).
- Identifying weak points: By calculating RTY, organizations can identify specific stages in the process where defects accumulate or where the yield is low. This helps pinpoint weak points or bottlenecks that need improvement.
- Quantifying process improvement: RTY allows organizations to track the impact of process improvement efforts over time. As defects are reduced at each stage, the RTY increases, providing a tangible measure of improvement.
- Focus on continuous improvement: The RTY calculation encourages a focus on continuous improvement. Organizations can set goals to increase RTY and implement strategies to achieve those objectives.
- Better resource allocation: Understanding the stages with the lowest yield helps allocate resources and efforts effectively. By targeting improvement efforts where they are most needed, organizations can optimize their resources.
- Enhanced customer satisfaction: Higher RTY indicates a more reliable and defect-free process. This, in turn, leads to improved product or service quality, ultimately enhancing customer satisfaction and loyalty.
- Decision-making support: RTY provides data-driven insights that support decision-making processes. It helps managers and stakeholders identify areas that require attention and prioritize improvement initiatives.
- Root cause analysis: When defects occur, RTY aids in root cause analysis by helping identify the stage(s) in the process responsible for the majority of defects. This information is valuable for implementing corrective actions.
- Process benchmarking: RTY can be used for benchmarking against industry standards or best practices. It allows organizations to compare their process performance with others in the same field.
- Cost savings: Improving RTY leads to reduced waste, rework, and scrap. As defects decrease, the costs associated with defects decrease, leading to potential cost savings for the organization.

Lean Six Sigma • Six Sigma • Statistics • Project Management • Artificial Intelligence (AI) • Operations Management • Quality Management
Conclusion
Rolled Throughput Yield (RTY) is far more than just a quality metric—it is a reality lens for your entire process. In many organizations, performance looks impressive on paper because final output numbers are high. However, these numbers often hide a significant amount of rework, waste, defects, and inefficiencies. RTY cuts through this illusion by focusing on what really matters:
How many products or services are delivered perfectly — without any defect — the first time?
This single perspective shift helps organizations move from reactive problem-solving (fixing defects) to proactive quality improvement (preventing defects).
In summary, calculating Rolled Throughput Yield provides valuable insights into the overall quality and efficiency of a process. It serves as a useful tool for process improvement initiatives, leading to enhanced productivity, customer satisfaction, and cost-effectiveness for the organization.
Continue Your Learning Journey
Learning is a continuous process. Explore related topics, practical guides, tools, calculators, templates, and learning resources to expand your knowledge and develop new skills.
Choose a category below to explore practical tutorials, tools, calculators, templates, case studies, and learning resources.
Recommended Learning Resources
Expert-led courses to build practical skills, earn credentials, and advance your career.
Recommended professional books, certification guides, and practical study resources.
Ready-to-use templates, checklists, guides, and workbooks for practical applications.
Interactive calculators for statistics, quality, engineering, analysis, and decision-making.
Interactive Z, t, Chi-Square, and F tables with critical values and distribution curves.
Discover practical tutorials, case studies, and professional resources across Quality, Lean Six Sigma, Project Management, Statistics, AI, and Data Analytics.
Published: March 12, 2021
Last Updated: September 18, 2026