What is OEE (Overall Equipment Effectiveness) — How Much of Your Machine’s True Potential Are You Really Using?
It was 2:00 p.m. on a busy production floor. The machine had been scheduled to run for eight hours, and according to the production report, everything looked reasonably good. The machine had been running most of the shift, operators had produced thousands of parts, and the line had met most of its production target.

At first glance, there didn’t seem to be a serious problem. But then the manufacturing engineer looked a little closer. During the shift, the machine had stopped several times because of minor breakdowns. A changeover had taken longer than planned. The machine had also been running below its ideal speed for much of the shift. And after all those hours of production, a significant number of parts still needed to be scrapped or reworked.
The machine was running. But was it actually effective? That simple question can reveal a very different picture of manufacturing performance. A machine can be available for production yet lose valuable time through breakdowns and changeovers. It can be running yet producing fewer parts than it should. And it can produce a large quantity of parts while still wasting capacity through defects and rework.
This is where OEE (Overall Equipment Effectiveness) becomes powerful.
OEE looks beyond a simple question such as “Was the machine running?” Instead, it asks three much more important questions:
Was the equipment available when it was supposed to run?
Did it run at its ideal speed when it was running?
Did it produce good parts the first time?
Together, these questions reveal how much of a machine’s true productive potential is actually being used.
And that is the real purpose of OEE.
It is not simply another percentage to display on a manufacturing dashboard. When measured correctly, OEE can help uncover hidden losses, identify where production capacity is disappearing, and provide a starting point for focused improvement.
What is OEE (Overall Equipment Effectiveness)?
OEE (Overall Equipment Effectiveness) is a manufacturing metric used to measure how effectively equipment performs during its planned production time.
In simple terms, OEE answers:
How much of our equipment’s planned productive potential are we actually achieving?
In my experience, one of the easiest mistakes to make on a production floor is to equate machine uptime with machine effectiveness.
A machine can run for most of a shift and still lose a significant amount of productive capacity through short stoppages, reduced speed, scrap, or rework. OEE (Overall Equipment Effectiveness) helps bring these losses into one clear picture.
At its core, OEE measures three things:
- Availability — Was the equipment running when it was planned to run?
- Performance — Did it run at its ideal cycle speed?
- Quality — Did it produce good parts without defects?
These three factors are combined as:
For example, if a machine has 90% Availability, 95% Performance, and 98% Quality, its OEE is:
90% × 95% × 98% = 83.8%
That number tells us something that uptime alone cannot. The machine may have been available for 90% of the planned time, but once speed and quality losses are considered, only 83.8% of its defined productive potential was achieved. That is why I see OEE as more than a dashboard KPI. The real value is not the percentage itself—it is understanding what is preventing the equipment from performing better.
And that starts with understanding its three pillars: Availability, Performance, and Quality.
Why OEE Matters: Your Machine May Be Losing More Than You Think
Many production managers assume that if a machine is running, it is productive. After all, the equipment is powered on, operators are busy, and products are coming off the line. On the surface, everything appears to be working as expected.
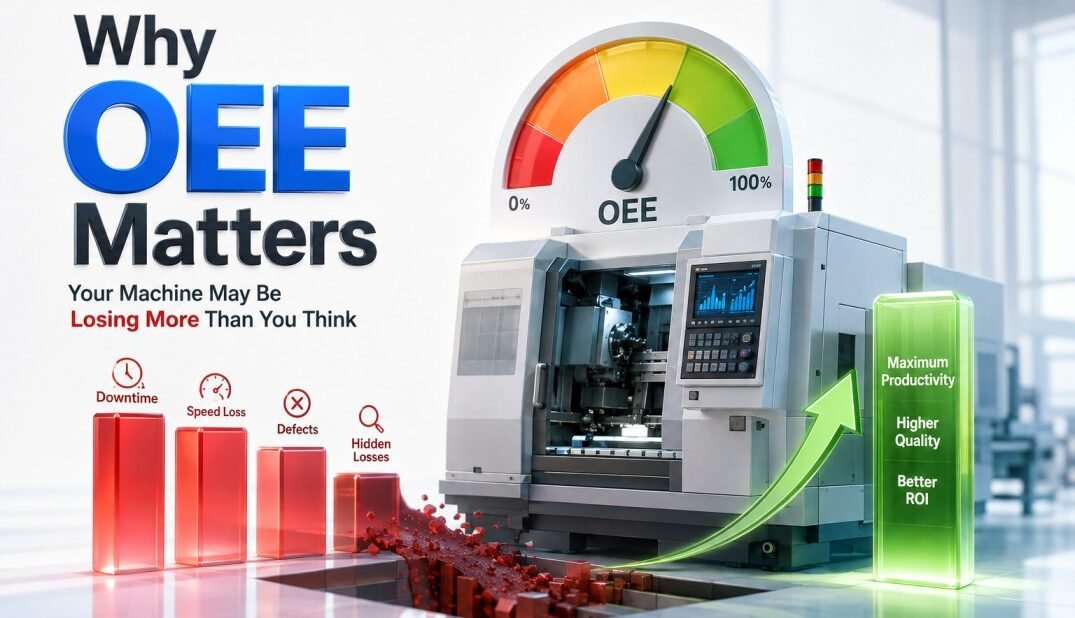
In reality, some of the biggest productivity losses in manufacturing occur while the machine is still running. I have seen situations where a production line achieved its daily output target, yet overtime hours continued to increase, maintenance teams were constantly firefighting breakdowns, and customer demand was becoming harder to meet. The machines were operating throughout the shift, but hidden losses were quietly reducing their true productive capacity.
A machine may stop several times a day for only a few minutes. Operators may slow the equipment down to avoid quality issues. Small defects may require rework. Individually, these losses seem minor. Combined, they can consume a surprisingly large percentage of available production time.
OEE brings three often-overlooked losses into one view: lost time, lost speed, and lost quality.
Consider a simple situation: two machines both complete 1,000 parts during a shift. One runs steadily with minimal downtime and rejects; the other reaches the same output only because it runs longer, experiences repeated stops, and requires rework.
The production report may show similar output. The OEE story can be very different.
That difference matters because recovering lost capacity from existing equipment can sometimes be more practical than immediately adding another machine, extending shifts, or increasing overtime.
For me, that is the real value of OEE:
It doesn’t just tell you how the machine performed. It helps you see where its potential was lost.
Once those losses are visible, the improvement conversation becomes much more focused—and much more useful.
The Three Pillars of OEE
At its core, Overall Equipment Effectiveness (OEE) is built upon three fundamental components: Availability, Performance, and Quality.
Think of these three pillars as the legs of a tripod. If any one of them is weak, overall equipment effectiveness suffers. Even if a machine performs exceptionally well in two areas, poor performance in the third area can significantly reduce its overall OEE score. When I analyze OEE on a production line, I don’t start with the final percentage. I first look at three questions: Was the equipment available? Did it run fast enough? And did it make good parts?

These are the three pillars of OEE:
1. Availability — Was the Machine Running When Planned?
Availability measures whether a machine is running when it is supposed to be running. Every minute of planned production time that is lost due to downtime reduces Availability.
Typical causes of lost Availability include:
- Equipment breakdowns
- Unplanned downtime
- Long setup and changeovers
- Waiting for maintenance or materials
A machine scheduled for 480 minutes but losing 60 minutes to downtime has only 420 minutes of actual run time.
Availability = Run Time ÷ Planned Production Time × 100
2. Performance — Was the Machine Running at Its Ideal Speed?
Performance measures how fast a machine operates compared with its ideal or designed speed. Many machines continue running even when they are not producing at their maximum capacity. This often makes performance losses difficult to detect.
Performance captures speed losses by comparing actual production against what the equipment could produce at its Ideal Cycle Time.
Typical causes include:
- Reduced operating speed
- Minor stops
- Short interruptions
- Process-related delays
For example, if a machine is capable of producing one part every 10 seconds but is actually averaging 12 seconds, the equipment is running—but not at its full potential.
Performance = (Ideal Cycle Time × Total Count) ÷ Run Time × 100
3. Quality — Did the Machine Produce Good Parts?
Quality measures how many products are manufactured correctly the first time without requiring rework or scrapping.
Producing large quantities of output is not beneficial if a significant percentage of products fail to meet quality requirements. The focus is not simply on how many parts were produced, but how many were produced correctly without requiring scrap or rework.
Typical quality losses include:
- Process defects
- Scrap
- Rework
- Startup or first-off defects
If 1,000 parts are produced but 30 are rejected, only 970 are good parts for the OEE calculation.
Quality = Good Count ÷ Total Count × 100
🎓 Top-Rated Courses & Certifications
Try changing your filters or searching for another course.
Six Big Losses Behind OEE
Whenever I’ve worked on improving OEE, I’ve noticed that the biggest opportunities rarely come from one major breakdown. More often, productivity is quietly lost through a series of small interruptions, speed reductions, setup delays, and quality issues that occur throughout the day.
These losses are commonly grouped into the Six Big Losses, which form the foundation of OEE and help explain why equipment rarely operates at its full potential.
What makes these losses challenging is that they often seem insignificant when viewed individually. A few minutes of downtime, a slightly slower cycle time, or a handful of defects may not attract much attention. However, when repeated shift after shift, they can have a significant impact on overall equipment effectiveness.
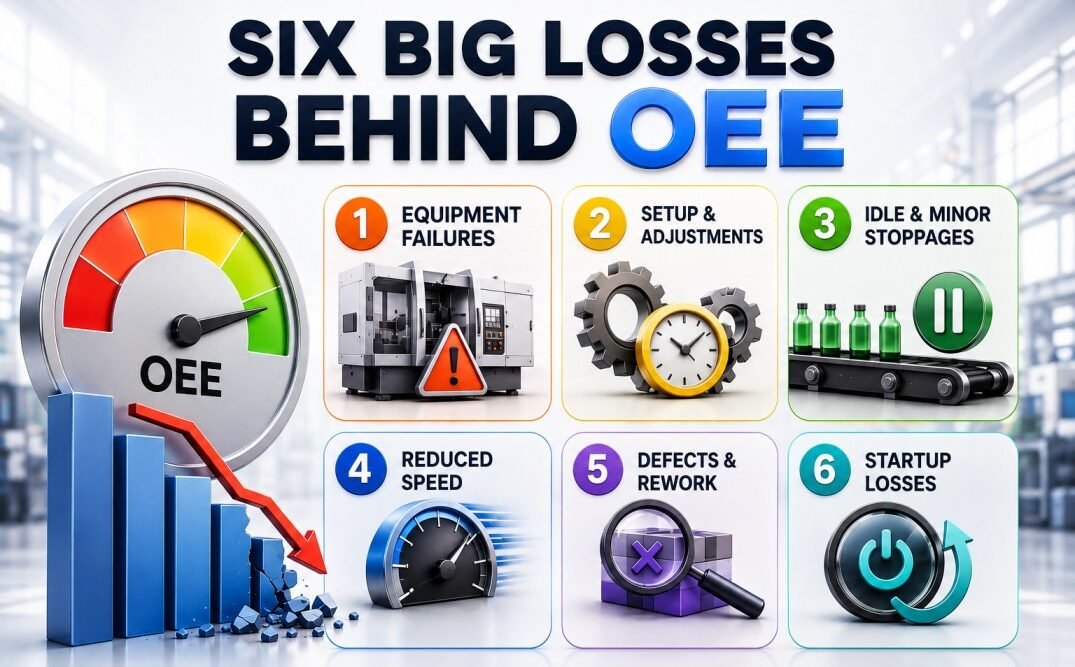
This is where the Six Big Losses become valuable. They help move the conversation from:
“Our OEE is low.”
to
“What exactly is causing the loss?”
In simple terms, OEE tells us how much productive potential is being lost, while the Six Big Losses help us understand where those losses are coming from. Since each loss deserves detailed attention, I’ll cover them separately in a dedicated guide on the Six Big Losses of OEE, including real manufacturing examples, practical improvement strategies, and common pitfalls I’ve encountered in continuous improvement projects.
The calculation is built around just three factors:
Each factor looks at a different way equipment can lose productive capacity:
- Availability — Was the equipment running when it was planned to run?
- Performance — Was it running at its ideal speed?
- Quality — Was it producing good parts?
For example, if a machine has:
Availability = 90%
Performance = 95%
Quality = 98%
Then:
OEE = 90% × 95% × 98% = 83.8%
The important point is that OEE is multiplied, not averaged. Strong performance in one area cannot completely compensate for a weakness in another.
This is why I prefer looking at the three components alongside the final OEE score. A machine might have excellent uptime but still lose substantial capacity because it runs slowly or produces defects.
In practical terms, OEE comes down to three questions:
Availability: Was it running?
Performance: Was it running fast enough?
Quality: Was it making good parts?
The answers reveal much more than the final percentage alone.
What is a Good OEE Score?

One of the most common questions I hear from engineers and production teams is:
“Is our OEE good or bad?”
The honest answer is that it depends on your industry, process complexity, product mix, and business goals. However, there are some widely accepted benchmarks that can serve as a useful starting point. The commonly quoted answer is 85%. But I would be careful about treating 85% as a universal target.
A better approach is to understand what is driving the current score and how much improvement is realistically available in a particular process. As a general reference, OEE is often interpreted roughly like this:
These ranges should be treated as guidance, not universal benchmarks. In my experience, the more useful question is not “Are we above 85%?” but:
“What is preventing us from achieving better performance, and is that loss worth attacking?”
For example, moving from 60% to 70% OEE can represent a major capacity improvement, even though the number is still below 85%. Likewise, pushing an already stable process from 90% to 92% may require far more effort for a much smaller gain. In my experience, the most effective approach is not comparing your OEE with someone else’s factory. Instead, focus on continuous improvement:
✅ Is OEE improving month over month?
✅ Are breakdowns becoming less frequent?
✅ Are speed losses being reduced?
✅ Is product quality becoming more consistent?
If the answer is yes, you’re moving in the right direction.
A good OEE score isn’t just a number on a dashboard. It’s evidence that your equipment is becoming more reliable, more productive, and more capable of meeting customer demand.
For many organizations, the goal should not be achieving a perfect OEE score. The goal should be understanding what is preventing the machine from reaching its full potential and systematically removing those barriers. 🚀
How to Measure OEE Correctly
Calculating OEE is relatively simple. Measuring it accurately is where many organizations struggle. The biggest OEE problems often start before the calculation. If downtime, production counts, cycle times, or defects are recorded inconsistently, even a perfectly calculated OEE number can be misleading.
A reliable OEE measurement starts with clearly defining the planned production time, downtime, ideal cycle time, total production, and good production.
The purpose of OEE is not to produce the highest possible score. The purpose is to reveal the truth about how effectively equipment is performing.
Don’t Ignore Small Losses
One mistake I’ve encountered repeatedly is ignoring short stoppages because they seem insignificant. A two-minute jam or a quick machine reset may not attract attention, but when these interruptions occur dozens of times a shift, they can significantly reduce overall effectiveness.
The same principle applies to speed losses. A machine running slightly below its ideal cycle time all day can lose more capacity than a single breakdown.
Measure What Really Reached the Customer
For the Quality component, I always focus on good parts produced the first time. If a product requires rework, time, labor, and resources have already been lost. Counting only conforming products provides a more realistic view of performance and highlights opportunities for improvement.
Be Consistent
A consistent OEE measurement system is far more valuable than a perfect OEE score. Use the same definitions, downtime categories, and calculation methods across shifts and reporting periods. Consistency makes trends visible and helps teams understand whether improvement efforts are actually working.
Use OEE as a Diagnostic Tool
One lesson I’ve learned from continuous improvement projects is that OEE should never be treated as a competition or scoreboard.
The goal isn’t to produce the highest number possible. The goal is to answer a much more important question:
Where are we losing productive capacity, and what can we do to recover it?
📚 Recommended Books for Professionals
Try removing one or more filters.
World-Class OEE Benchmarks by Industry
The widely quoted 85% OEE is useful as a reference point, but it should not be treated as a universal industry standard. Even Lean Enterprise Institute material cautions against treating a single number as the definition of world-class performance.
In practice, OEE depends heavily on the equipment, process, product mix, changeover requirements, and how consistently the metric is measured.
Should You Always Target 85%?
Typical Industry Expectations :

Not necessarily.
I would rather see a manufacturing team improve a process from 60% to 75% with clearly understood losses than report an 85% OEE based on inconsistent data or favorable measurement rules.
Common OEE Mistakes That Can Produce Misleading Results
Over the years, I’ve found that OEE itself is rarely the problem. The way it is measured is. A polished dashboard can show a healthy OEE while important losses remain hidden.
Here are the mistakes I pay the most attention to:
Ignoring Minor Stops : A machine may lose only a minute or two at a time through jams, sensor issues, or operator interventions. These events are easy to dismiss, but repeated throughout a shift, they can become a significant Performance loss.
Using an Unrealistic Ideal Cycle Time : If the reference cycle time is gradually adjusted to match actual performance, the OEE may improve on paper while the machine hasn't improved at all. Ideal Cycle Time should represent a realistic, proven best operating condition—not simply today's average.
Leaving Downtime Out : Breakdowns are usually easy to record. Waiting, changeovers, adjustments, and other interruptions are easier to overlook. If different teams classify these events differently, Availability becomes difficult to trust.
Treating Rework as Good Production : A reworked part may eventually become acceptable, but it has already consumed additional time and resources. Quality losses should not disappear simply because the part was recovered later.
Chasing the OEE Percentage : This is the trap I would avoid most. When teams focus on “How do we get OEE above 85%?”, there can be a temptation to change definitions or exclude inconvenient losses.
I prefer a different question: “What is preventing this equipment from performing better?”
That keeps the focus on improvement rather than the score.
Using Different Rules Across Shifts : If one shift counts a particular event as downtime and another doesn't, their OEE numbers cannot be meaningfully compared. Consistent definitions are essential.
The Key Takeaway : A realistic 65% OEE is far more valuable than an artificial 85% OEE if the first number accurately reflects what is happening on the production floor. OEE should expose losses—not hide them. When the measurement is consistent and honest, the percentage becomes much more than a KPI. It becomes a starting point for improvement.
How to Improve OEE: A Practical Improvement Roadmap
The best way to improve OEE is not to chase the OEE percentage directly. The real improvement starts when you identify the specific losses behind the number.
A low OEE score is usually a signal. It tells you that something is reducing the machine’s true potential, but the score alone does not solve the problem. You need to break it down into Availability, Performance, and Quality.
If Availability is low, start with downtime. Look at recurring breakdowns, setup delays, waiting time, and maintenance issues. Sometimes even basic actions like better preventive maintenance, operator checks, and faster changeovers can recover a lot of lost capacity.
If Performance is low, the machine may be running, but not at its ideal speed. This is where small stops, slow cycles, material flow issues, and operator adjustments need attention. I have seen many cases where the machine looked busy all day, but speed losses were quietly reducing output.
If Quality is low, focus on defects, rework, scrap, and startup losses. A machine producing defective parts is still consuming time, labor, material, and energy. Improving first-pass quality often has a direct impact on OEE.
A practical OEE improvement roadmap looks like this:
- Identify the biggest loss.
- Understand the root cause.
- Fix one major issue at a time.
- Track the result.
- Standardize what works.
- Repeat the cycle.
The mistake many teams make is trying to improve everything at once. In real manufacturing environments, focused improvement usually works better. Pick the biggest loss, solve it properly, and then move to the next one.
The goal is not to make the OEE number look better. The goal is to remove the real losses that are stopping the equipment from performing at its full potential.
When used correctly, OEE becomes more than a dashboard metric. It becomes a practical roadmap for improving reliability, speed, quality, and overall manufacturing performance.
OEE Calculation: A Complete Real-World Example
The best way to understand OEE is to calculate it using a real production scenario. Let's assume a machine is scheduled to run for an 8-hour shift. During the shift, it experiences some downtime, runs slightly below its ideal speed, and produces a small number of defective parts. This is a situation I've seen many times in manufacturing environments and is far more realistic than the perfect examples often used in training materials.
Production Data
Step 1: Calculate Availability
First, determine the actual production time available.
Planned Production Time : 480 - 30 = 450 Minutes
Operating Time : 450 - 60 = 390 Minutes
Availability = Operating Time ÷ Planned Production Time
Availability = 390 ÷ 450
Availability = 86.7%
This means the machine was available for production 86.7% of the scheduled production time.
Step 2: Calculate Performance
Next, compare actual production against the machine's ideal production capability. At an ideal cycle time of 1 minute per unit, the machine should have produced: 390 Units
However, actual production was: 400 Units
Performance = (Ideal Cycle Time × Total Units Produced)÷ Operating Time
Performance = (1 × 400) ÷ 390
Performance = 102.6%
In practice, Performance is typically capped at 100%, as values above 100% usually indicate the ideal cycle time needs verification.
For this example: Performance = 100%
Step 3: Calculate Quality
Now determine how many units were produced correctly the first time.
Good Units : 400 - 20 = 380 Units
Quality = Good Units ÷ Total Units Produced
Quality = 380 ÷ 400
Quality = 95%
This means 95% of production met quality requirements without defects or rework.
Step 4: Calculate OEE
Now combine all three components.
OEE = Availability × Performance × Quality
OEE = 86.7% × 100% × 95%
OEE = 82.4%
Final Result
| OEE Component | Score |
|---|---|
| Availability | 86.7% |
| Performance | 100% |
| Quality | 95.0% |
| Overall OEE | 82.4% |
What Does This Result Tell Us?
An OEE of 82.4% is a strong result and close to the commonly referenced world-class benchmark of 85%.
The calculation also highlights something important: the largest opportunity for improvement is not quality or speed. The biggest loss comes from downtime, which reduced Availability to 86.7%.
This is one reason I find OEE so valuable. Instead of simply telling us that performance could be better, it helps pinpoint where the biggest opportunity exists. In this example, reducing downtime would likely have the greatest impact on overall equipment effectiveness.
OEE is more than a number. It tells a story about how effectively a machine is being used and where its hidden capacity is being lost. 🚀

Lean Six Sigma • Six Sigma • Statistics • Project Management • Artificial Intelligence (AI) • Operations Management • Quality Management
OEE Calculator (Interactive Example)
Use this interactive OEE calculator to evaluate how effectively your equipment is performing. Simply enter your production data and the calculator will instantly determine Availability, Performance, Quality, and Overall OEE, helping you identify where productive capacity is being lost.
💡 Tip: If your OEE is lower than expected, focus on the weakest component first. Small improvements in downtime, speed, or quality can often unlock significant hidden capacity without investing in new equipment.
OEE Calculator
Enter your production data to calculate Availability, Performance, Quality, and Overall Equipment Effectiveness.
OEE Performance Dashboard
Your OEE is good, but there may still be meaningful improvement opportunities.
Biggest Improvement Focus
Performance appears to be the biggest opportunity. Review minor stops, reduced speed, bottlenecks, and cycle time variation.
Hidden Capacity Opportunity
Improving OEE from 61.8% to 85.0% could unlock approximately 37.5% additional productive capacity from the same equipment.
Frequently Asked Questions (FAQs)
Q. What does OEE stand for?
OEE (Overall Equipment Effectiveness) is a manufacturing KPI used to measure how effectively equipment is utilized during production.
Q. What is the formula for OEE?
OEE = Availability × Performance × Quality. It combines uptime, operating speed, and product quality into a single metric.
Q. What is considered a good OEE score?
In most manufacturing environments, 60% to 85% is considered good, while 85% or above is often referenced as world-class performance.
Q. Can OEE be higher than 100%?
No. 100% represents perfect production, with no downtime, no speed losses, and no quality defects.
Q. Why is OEE important?
OEE helps identify hidden productivity losses and highlights where equipment performance can be improved without investing in new machinery.
Q. What are the three components of OEE?
The three components are Availability, Performance, and Quality.
Q. What lowers OEE the most?
The most common causes are breakdowns, changeovers, speed losses, minor stops, defects, and rework.
Q. Is OEE only used in manufacturing?
While OEE is primarily a manufacturing metric, its principles can also be applied to other equipment-intensive operations.
Q. What's the difference between OEE and productivity?
Productivity measures output, while OEE measures how effectively equipment converts available production time into good products.
Q. How often should OEE be measured?
Most organizations monitor OEE daily, weekly, and monthly to track trends and measure improvement efforts.
Q. Is a low OEE always a bad sign?
Not necessarily. A low OEE often reveals improvement opportunities that were previously hidden.
Q. What is the fastest way to improve OEE?
Start by identifying the largest loss, whether it's downtime, speed reduction, or quality issues, and focus your efforts there first.
Q. Why do some factories have high OEE but still struggle?
A high OEE does not automatically guarantee profitability, customer satisfaction, or on-time delivery. It should be evaluated alongside other business metrics.
Q. Is OEE a Lean Manufacturing metric?
Yes. OEE is widely used in Lean Manufacturing, Total Productive Maintenance (TPM), Operational Excellence, and Continuous Improvement initiatives.
Conclusion
Throughout my career, I've found that OEE is most valuable when it starts the right conversations. A machine can be running all day and still lose a surprising amount of productivity through downtime, speed losses, and quality issues. Those losses often remain hidden until they are measured. That's why OEE matters. It helps move the discussion beyond output numbers and focuses attention on how effectively equipment is actually being used.
More importantly, OEE is not about achieving a perfect score. The best-performing teams I've worked with don't spend their time chasing percentages. They focus on understanding losses, solving problems, and making small improvements consistently.
The real power of OEE isn't the number itself. It's the insight it provides into where productive capacity is being lost and how that capacity can be recovered.
If you're just starting your OEE journey, don't worry about reaching world-class levels overnight. Start with accurate data, identify the biggest loss, and improve one issue at a time. Small improvements made consistently often deliver the biggest long-term results. At the end of the day, OEE helps answer a simple but powerful question:
How much of your machine's true potential are you really using? 🚀
Continue Your Learning Journey
Learning is a continuous process. Explore related topics, practical guides, tools, calculators, templates, and learning resources to expand your knowledge and develop new skills.
Choose a category below to explore practical tutorials, tools, calculators, templates, case studies, and learning resources.
Recommended Learning Resources
Expert-led courses to build practical skills, earn credentials, and advance your career.
Recommended professional books, certification guides, and practical study resources.
Ready-to-use templates, checklists, guides, and workbooks for practical applications.
Interactive calculators for statistics, quality, engineering, analysis, and decision-making.
Interactive Z, t, Chi-Square, and F tables with critical values and distribution curves.
Discover practical tutorials, case studies, and professional resources across Quality, Lean Six Sigma, Project Management, Statistics, AI, and Data Analytics.
Published: August 15, 2026
Last Updated: September 18, 2026