What is BCG Matrix in Strategic Management : How Companies Prioritize Products and Allocate Resources
Organizations rarely have unlimited resources. Every business must make difficult decisions about where to invest, which products to grow, which offerings to maintain, and when it may be time to exit a market. The challenge becomes even greater when multiple products compete for the same budget, talent, and management attention.
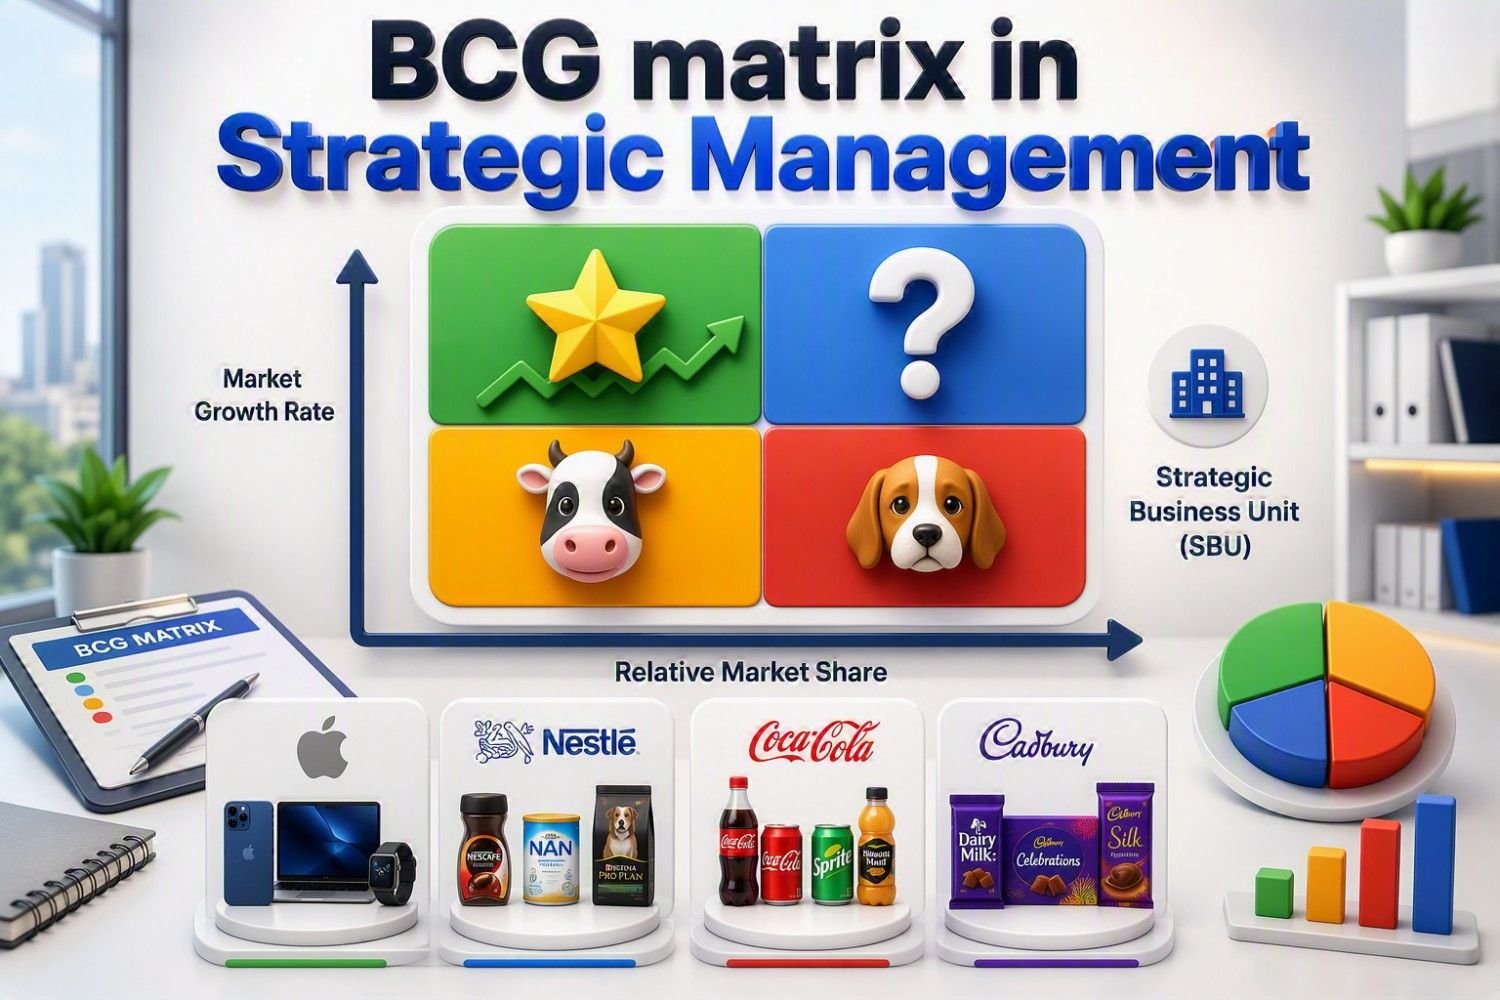
Successful companies do not rely solely on intuition when making these decisions. Instead, they use strategic frameworks that help evaluate opportunities, balance short-term profitability with long-term growth, and allocate resources more effectively across their product portfolio.
One of the most widely recognized strategic planning tools is the BCG Matrix. For decades, business leaders, product managers, marketing teams, and executives have used it to evaluate product portfolios, identify growth opportunities, and support investment decisions. Its simple visual structure helps organizations think strategically about where products stand today and how they may contribute to future business success.
Why Some Products Succeed While Others Fail
Have you ever wondered why some products become market leaders while others disappear despite having strong technology, talented teams, and significant investment behind them?
From my experience working with products, quality, and business decision-making, I have learned that product success is not just about building a great solution. A product succeeds when companies understand customer needs, market opportunities, competition, and where to focus their limited resources.
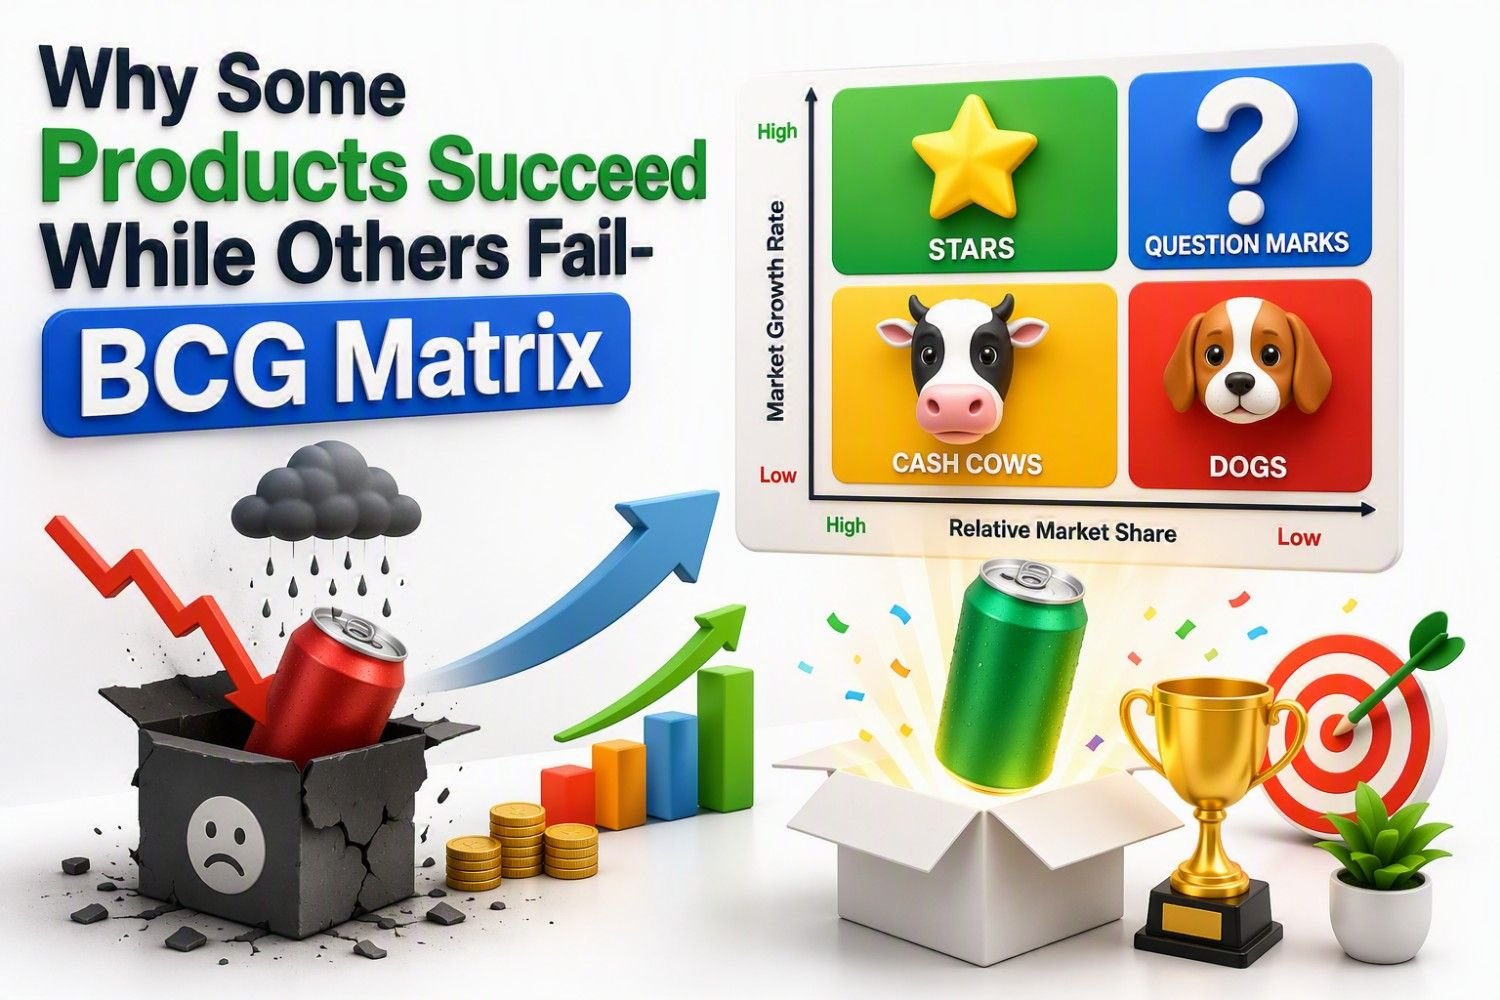
One common mistake I have observed is that organizations sometimes continue investing in products simply because they were successful in the past. However, markets change, customer expectations evolve, and competitors introduce better alternatives. A product that was once a strong revenue generator may not always be the best opportunity for future growth.
Successful companies constantly evaluate their product portfolios and make difficult decisions — which products need more investment, which products should continue generating returns, and which products no longer justify additional resources. This balance between current profitability and future growth is what separates successful product strategies from failed ones. This is where the BCG Matrix becomes a valuable strategic tool. It helps organizations evaluate products based on market growth and competitive position, allowing leaders to make smarter investment decisions instead of relying only on assumptions or past success.
In the following sections, we will explore how the BCG Matrix helps companies identify Stars, Cash Cows, Question Marks, and Dogs, and how these categories guide product investment decisions.
What is the BCG Matrix?
The BCG Matrix (Boston Consulting Group Matrix) is a strategic management tool that helps companies decide where to invest their resources across different products, services, or business units. Instead of treating every product the same, it helps leaders identify which offerings have future growth potential, which ones generate steady profits, and which ones may no longer deserve significant investment.
Also known as the Growth-Share Matrix, the framework evaluates products or Strategic Business Units (SBUs) using two factors: market growth rate and relative market share. Based on these factors, products are classified into four categories: Stars, Cash Cows, Question Marks, and Dogs.
The concept was introduced by Boston Consulting Group in the early 1970s to solve a common business challenge: companies often have limited resources but multiple products competing for investment. Leaders need a structured way to decide where to put their money, people, and attention for the best long-term return.
From my experience working with products and improvement initiatives, I have seen that the biggest challenge is not creating a product portfolio — it is knowing where to focus. Companies sometimes continue investing in products because of past success, even when market conditions have changed. The BCG Matrix helps bring a more objective view by encouraging teams to evaluate performance, growth opportunities, and future potential.
The real value of the BCG Matrix is not simply placing products into four boxes. It is the strategic discussion that follows: Which products should we invest in? Which ones should continue generating returns? And which ones should we reconsider? These decisions help organizations build a balanced portfolio and create a stronger path for future growth.
🎓 Top-Rated Courses & Certifications
Try changing your filters or searching for another course.
Understanding How the BCG Matrix Works
A simple way to understand the BCG Matrix is to think about managing a family budget. One family member may have a stable income that supports the household, another may need investment today but has the potential to earn more in the future, while another may continue using resources without a clear return.
A smart family does not spend equally in every situation. They evaluate where money, time, and support will create the best outcome. Companies face the same challenge when managing multiple products or business units. They must decide which products deserve more investment, which ones should continue generating profits, and which ones may need a different strategy.
The BCG Matrix helps organizations make these decisions by evaluating products based on three important concepts:
1. Market Growth Rate
It shows how quickly a market is expanding and whether there is future opportunity for growth.
A high-growth market generally signals opportunity. Demand may be rising, new customers may be entering, and the category may still be gaining attention. But high growth also means a company often needs to spend aggressively—on production, marketing, distribution, talent, or technology—to remain competitive.
A low-growth market usually suggests that the category is mature. Demand may still be strong, but the explosive expansion phase is over. This does not necessarily mean the market is unattractive. In fact, low-growth markets can contain the most profitable products in a company’s portfolio if those products already hold leading positions and do not require massive reinvestment.
This is the 1st Variable n Y- axis is is the Market Growth Rate. It is the rate at which a market’s size is growing. We can figure out the market growth rate from industry reports, which are usually available online. So the formulae to calculate Market growth rate is
Say for examples if your company’s sales is growing by 15%, but the industry is growing by 20%, you are lagging behind your competition by 5% or Industry is growing at 12%, then you are leading ahead of your competition by 3%. Competition is very severe in markets that has low growth. Now every company is fighting to get some share in the fixed pie.
2. Relative Market Share
It indicates a product’s competitive position compared with its major competitors and reflects its strength in the marketplace.
Relative market share compares your market share with the market share of your largest competitor. This is one of the most important parts of the BCG Matrix because it is not asking, ‘What is our share in isolation?’ It is asking, ‘How strong are we compared with the strongest rival?’ That comparison matters because strategy is rarely won in a vacuum.
A relative market share above 1.0 means you are ahead of the largest competitor. A relative market share below 1.0 means the largest competitor is ahead of you. This is why the horizontal midpoint in many BCG matrices is set at 1.0.
The 2nd variable on X- axis is the Relative Market share. One such assumption that we take in BCG matrix is that if a company has very good market share then it is successful from a financial standpoint. Market share is generally expressed as a percentage and to have high market share, you generally have to be in market for a very long time, have been benefited from economies of scale and customers have purchased your products and have been somewhat satisfied if you’re going to generate high market share.
Market share is defined in terms of the percentage of your company in the industry that is measured either in revenue terms or unit volume terms. So the formulae to calculate market share is :
Say for example, let’s say that the total sales in your industry were $10 million last year. Your company sales total sales is $100,000. The to calculate market share we have $100,000 / $10 million. It come to .01 and If we multiply this by 100, you find that your market share is 1%.
3. Strategic Business Unit (SBU)
An SBU is a product, service, or business segment that can be analyzed separately based on its customers, competition, and business objectives.
The idea behind the BCG Matrix is simple: products in growing markets often require investment, while products with strong market positions can generate returns that support future opportunities.
In my experience, the biggest challenge for organizations is not creating products — it is deciding where to focus limited resources. Teams often have different opinions about which products deserve more attention. The BCG Matrix brings structure to these discussions by helping leaders evaluate opportunities using common criteria instead of assumptions.
Although modern businesses use advanced analytics and financial models today, the BCG Matrix remains a valuable starting point for understanding product portfolios and making smarter strategic decisions.
📚 Recommended Books for Professionals
Try removing one or more filters.
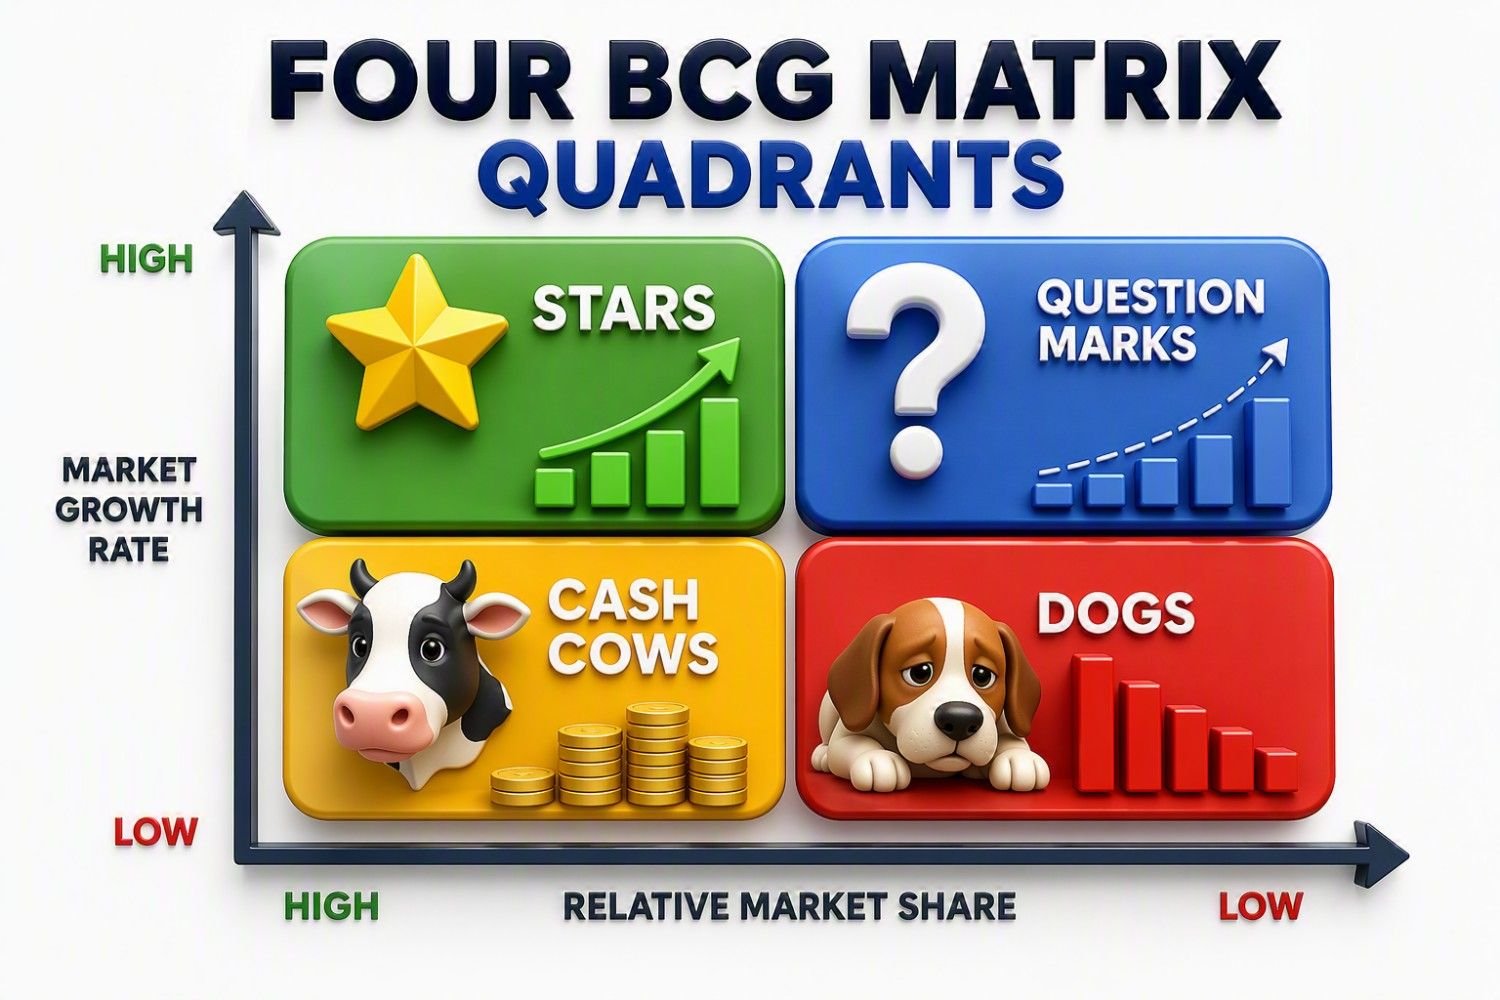
Four BCG Matrix Quadrants
⭐ Stars: High Growth, High Relative Market Share
Stars are products or business units that operate in high-growth markets while maintaining a strong competitive position. These products usually have high customer demand and the potential to become major revenue drivers in the future.
However, Stars often require continuous investment in areas such as innovation, marketing, and customer experience to maintain their market leadership. A common mistake I have seen is assuming that successful products can grow without ongoing improvement.
The right strategy for Stars is Invest and Grow. Companies should continue strengthening these products until they mature into Cash Cows — products that generate consistent profits and support future growth opportunities.
🐄 Cash Cows: Low Growth, High Relative Market Share
Cash Cows are products or business units that have a strong market position but operate in mature, low-growth markets. These products typically generate steady revenue and require less investment compared with Stars.
From my experience, Cash Cows are often the backbone of a product portfolio because they provide the financial stability needed to support new ideas and future growth opportunities. However, companies should continue improving them to protect their market position and customer loyalty.
The right strategy for Cash Cows is Maintain and Maximize. Companies should use the profits generated by these products to fund innovation, expand promising products, and build the next generation of growth opportunities.
❓Question Marks: High Growth, Low Relative Market Share
Question Marks are products or business units operating in high-growth markets but with a weaker competitive position. These products have potential, but companies need to decide whether they are worth further investment.
From my experience, this is often the most challenging category because teams can become emotionally attached to products with future promise. The key is to evaluate market opportunity, customer demand, and competitive strength before committing more resources.
The right strategy for Question Marks is Analyze and Decide. Companies should either invest to build market share and turn them into Stars or reduce support if the growth potential does not justify the investment.
🐕Dogs: Low Growth, Low Relative Market Share
Dogs are products or business units with low market share in slow-growing markets. These products often generate limited returns and may require more resources than the value they provide.
From my experience, companies sometimes continue supporting products because of past success or emotional attachment. However, regular portfolio reviews help leaders identify when resources could create more value elsewhere.
The right strategy for Dogs is Evaluate and Decide. Companies may choose to maintain them for a specific reason, reposition them, or gradually phase them out to focus on stronger growth opportunities.
How Companies Decide Which Products Become Stars or Cash Cows
Companies do not decide that a product will become a Star or Cash Cow based on assumptions alone. These decisions come from continuously evaluating factors such as customer demand, market growth, competitive position, profitability, and future potential.
Companies do not decide that a product will become a Star or Cash Cow based on assumptions alone. These decisions come from continuously evaluating factors such as customer demand, market growth, competitive position, profitability, and future potential.
A product becomes a Star when it gains a strong position in a growing market. Companies usually support these products with investments in innovation, marketing, capacity, and customer experience to strengthen their advantage.
A Cash Cow, on the other hand, is typically a mature product that has already established strong market share. Instead of requiring heavy investment, it generates consistent profits that can be used to support new products and growth opportunities.
From my experience working with products and improvement initiatives, the biggest challenge is not identifying successful products — it is knowing where continued investment will create the most value. Markets change quickly, and products that perform well today may need a different strategy tomorrow.
The BCG Matrix helps companies have these strategic conversations by answering three important questions: Where should we invest? Which products should we maintain? And where should we reduce focus to use resources more effectively?
How to construct BCG Matrix ?
Creating a BCG Matrix involves analyzing products or business units based on two key factors: market growth rate and relative market share. The goal is to understand where each product stands and decide the right strategy for investment, maintenance, or exit.
Step 1: Identify Strategic Business Units (SBUs)
Start by listing the products, services, or business segments you want to evaluate. Each SBU should have its own customers, competitors, and market position.
Step 2: Analyze Market Growth Rate
Evaluate whether the market for each product is growing quickly or slowly. High-growth markets usually represent future opportunities but may require more investment.
Step 3: Determine Relative Market Share
Compare each product’s market share with its strongest competitor. A higher relative market share generally indicates a stronger competitive position.
Step 4: Plot Products on the Matrix
Place each product on the four-quadrant BCG Matrix:
- ⭐ Stars – High growth, high market share
- 🐄 Cash Cows – Low growth, high market share
- ❓ Question Marks – High growth, low market share
- 🐕 Dogs – Low growth, low market share
Step 5: Decide the Strategy
Once products are positioned, companies can decide where to invest, maintain focus, or reduce resources based on business priorities.
From my experience, the value of constructing a BCG Matrix is not just creating the chart — it is the discussion that happens afterward. It helps teams move beyond opinions and make more structured decisions about where limited resources can create the greatest impact.
BCG Matrix of best Companies
Apple BCG matrix / BCG Matrix of Apple Company:
Apple is one of the most valuable companies in the world, with a diverse portfolio of products and services that serve millions of customers globally. One reason behind Apple's long-term success is its ability to continuously evaluate where to invest resources, which products to expand, and which opportunities will drive future growth. The BCG Matrix provides an excellent framework for understanding how different Apple products contribute to the company's overall strategy.
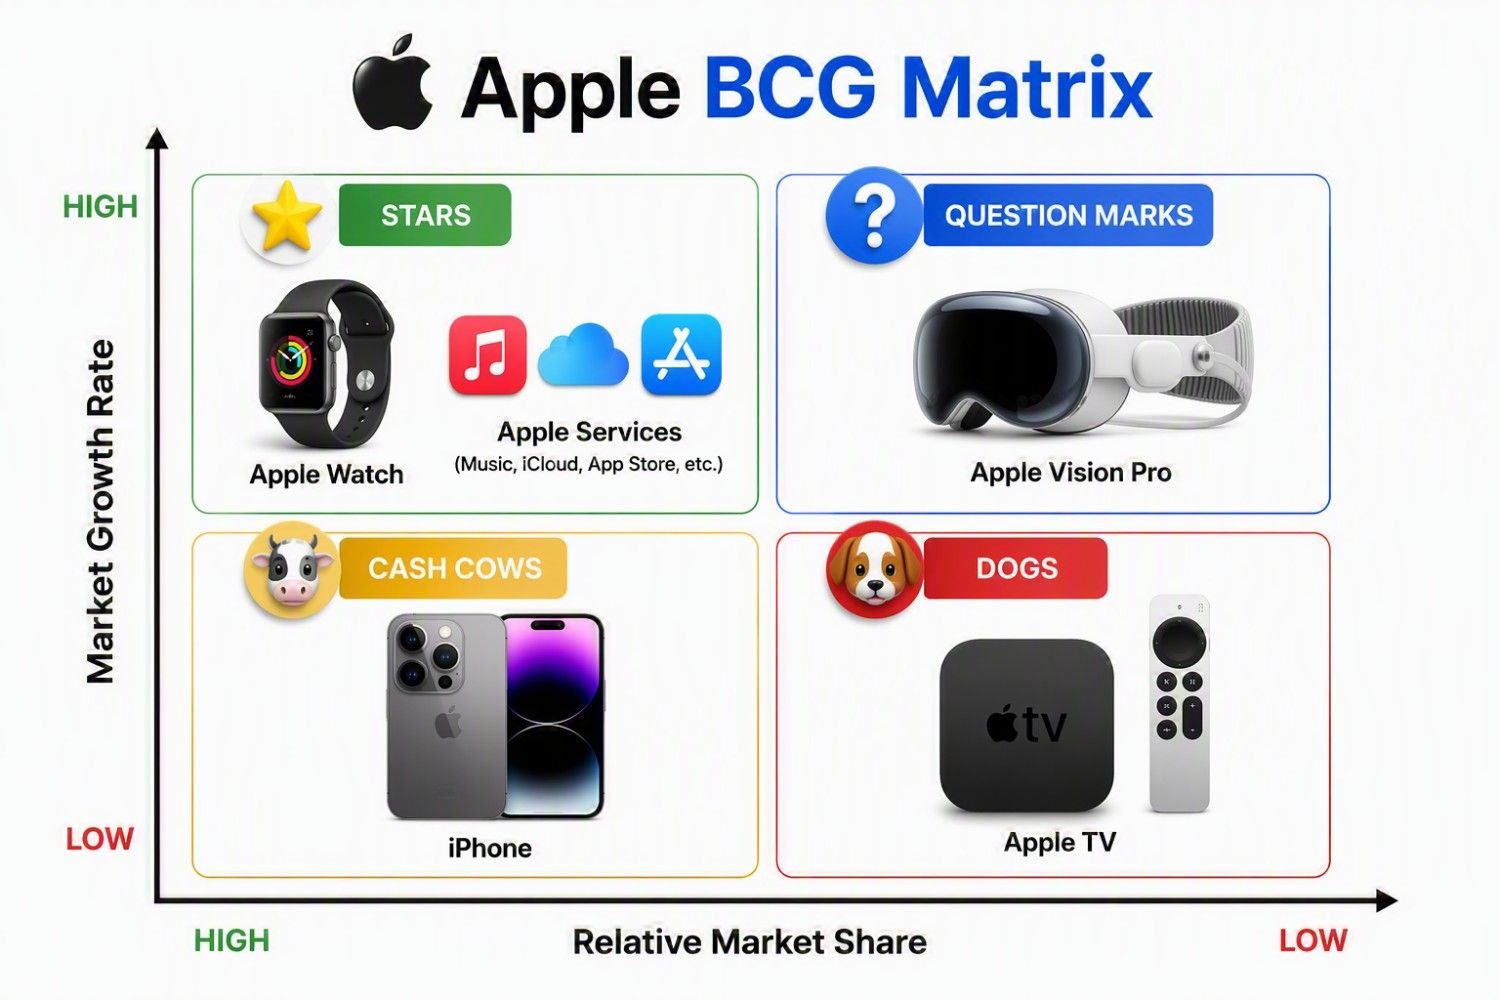
Although Apple does not officially publish a BCG Matrix, we can apply the framework to its major product categories to understand their strategic positions. It is important to remember that product classifications may change over time as markets evolve, customer preferences shift, and new technologies emerge.
Coca Cola BCG Matrix / BCG Matrix of Coca-Cola
When discussing successful brand portfolio management, The Coca-Cola Company is often considered one of the best real-world examples. Unlike companies that depend on a single product, Coca-Cola manages hundreds of beverage brands across soft drinks, water, energy drinks, juices, coffee, sports drinks, and teas. This diversified portfolio makes Coca-Cola an excellent candidate for BCG Matrix analysis because different products are at different stages of growth and profitability.
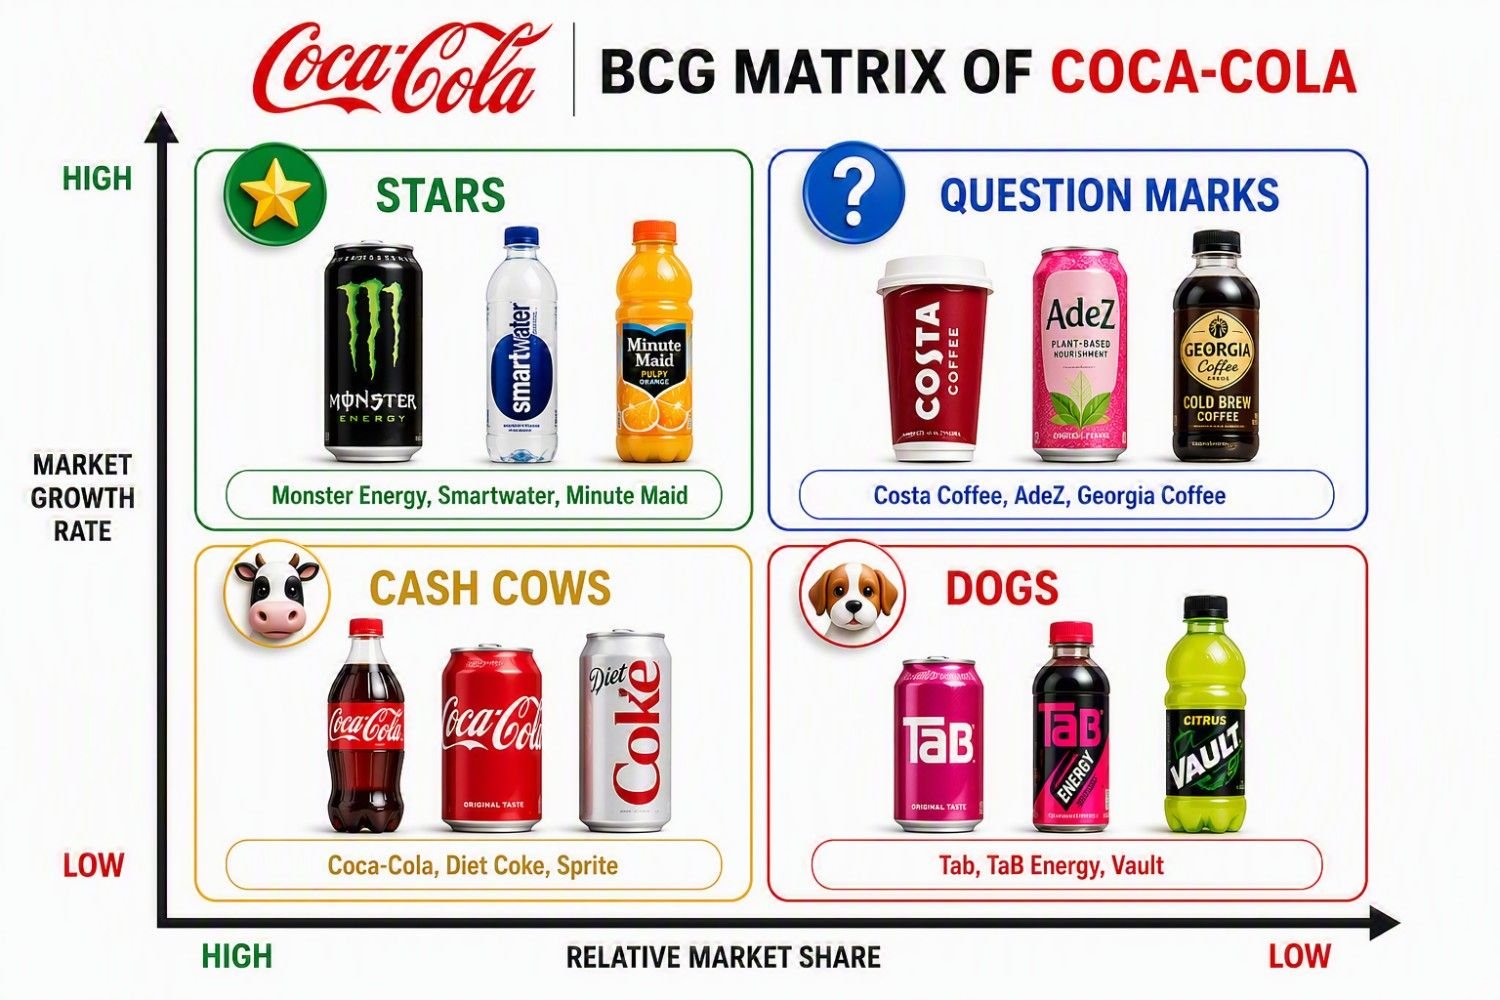
Although Coca-Cola does not officially classify its products within a BCG Matrix, we can apply the framework to understand how various beverage categories contribute to the company's business strategy. This analysis illustrates how mature products generate cash while emerging categories create future growth opportunities.
Nestle BCG Matrix / BCG matrix of Nestle
When it comes to managing a large and diverse product portfolio, Nestlé is often cited as one of the best examples in the business world. Operating in more than 180 countries, Nestlé owns thousands of products across categories such as coffee, infant nutrition, dairy products, bottled water, pet care, chocolates, and health science solutions. Because not all product categories grow at the same rate or generate the same profits, Nestlé must constantly decide where to invest, where to maintain its position, and where to reduce focus. This is exactly the type of challenge the BCG Matrix was designed to address.
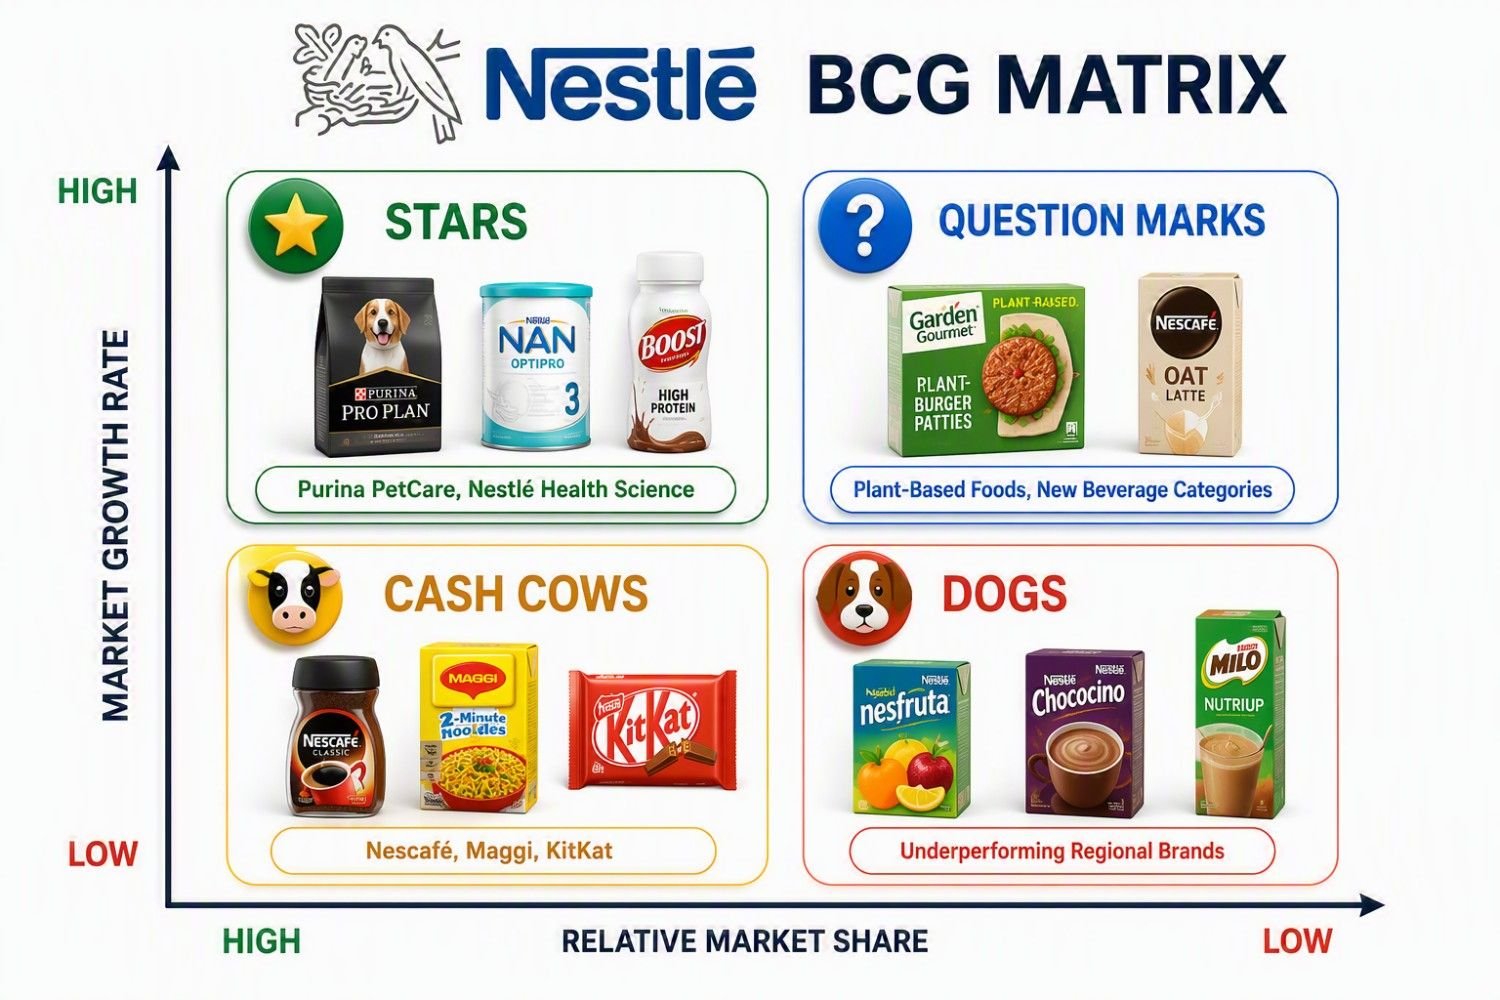
Although Nestlé does not publicly publish a BCG Matrix, we can apply the framework to its major brands and business segments to understand how they contribute to the company's overall strategy. This exercise provides an excellent real-world example of how multinational corporations balance mature profit-generating products with emerging growth opportunities.
Cadbury BCG matrix / BCG matrix of Cadbury
Cadbury is one of the world's most recognized chocolate brands and a flagship confectionery business within Mondelez International. Over the decades, Cadbury has built a diverse portfolio that includes chocolates, gifting products, seasonal offerings, biscuits, cocoa beverages, and premium confectionery. Like any successful consumer goods company, Cadbury must decide which brands deserve additional investment, which products generate steady profits, and which new opportunities have the potential to drive future growth. The BCG Matrix provides a useful framework for understanding these strategic decisions.
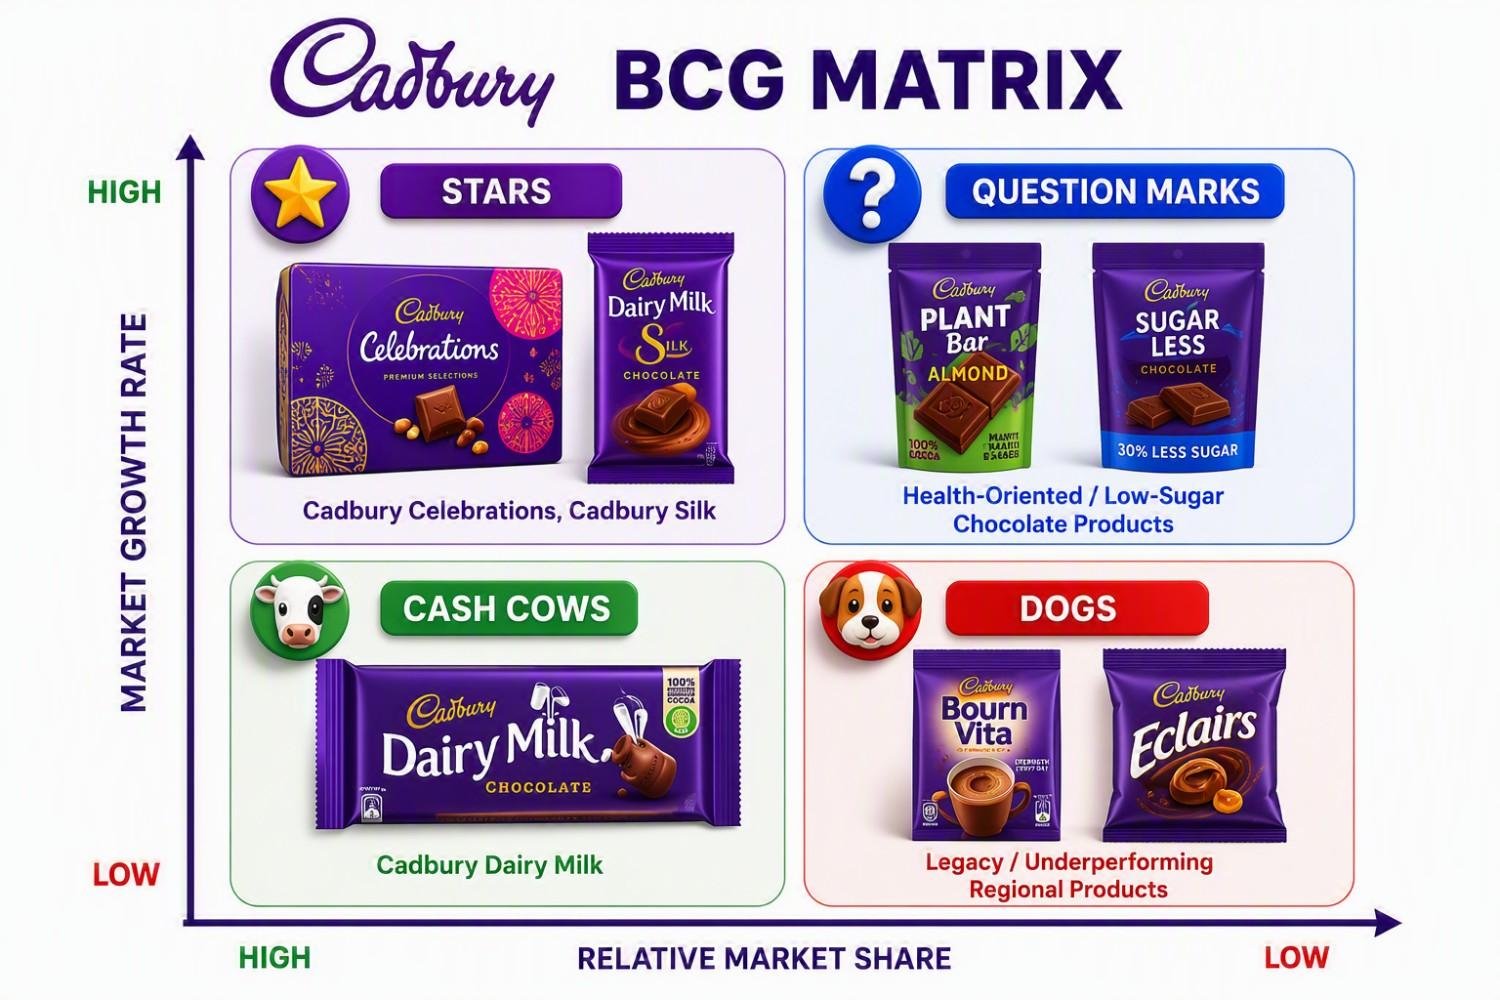
Although Cadbury does not publicly classify its products using the BCG Matrix, we can apply the framework to its major product categories and brands to better understand its portfolio strategy. This analysis demonstrates how mature best-selling products generate cash while newer categories create opportunities for future expansion.
BCG Matrix Template (Free Download)
📥 Download the free BCG Matrix Template to evaluate products, services, or business units and make smarter portfolio investment decisions. This practical toolkit includes a ready-to-use BCG Matrix worksheet, market growth rate calculator, relative market share calculator, product portfolio assessment template, strategic action planning sheet, and a completed example to help you classify products as Stars, Cash Cows, Question Marks, or Dogs and develop effective growth strategies.
⬇️ Download Template

Lean Six Sigma • Six Sigma • Statistics • Project Management • Artificial Intelligence (AI) • Operations Management • Quality Management
Frequently Asked Questions (FAQs)
1. What is the BCG Matrix in simple words?
The BCG Matrix is a business tool that helps companies decide where to invest, where to maintain, and what to stop by comparing market growth and relative market share.
2. What does BCG stand for?
BCG stands for Boston Consulting Group, the consulting firm associated with the framework.
3. Who created the BCG Matrix?
BCG states that Alan Zakon first sketched the idea and Bruce Henderson popularized it in 1970 through the essay The Product Portfolio.
4. What are the four quadrants of the BCG Matrix?
The four quadrants are Stars, Cash Cows, Question Marks, and Dogs.
5. What is the purpose of the BCG Matrix?
Its purpose is to analyze a portfolio of products or business units and support better investment and resource-allocation decisions.
6. What is a Star in the BCG Matrix?
A Star is a product with high market share in a high-growth market. It has strong potential but usually still needs investment.
7. What is a Cash Cow in the BCG Matrix?
A Cash Cow is a product with high market share in a low-growth market. It often generates more cash than it needs and can fund other parts of the portfolio.
8. How do you calculate relative market share?
Relative market share is calculated by dividing your market share by the market share of your largest competitor.
9.How do you calculate market growth rate for the matrix?
A simple method is to compare current market size with previous market size and convert the change into a percentage.
10. Where should a company invest most?
Usually in Stars and selected Question Marks with a real chance of becoming leaders, while protecting strong Cash Cows and avoiding wasteful support of weak units.
Conclusion
In conclusion, while the BCG Matrix remains a valuable tool for assessing a company's product portfolio, it is crucial to be aware of its limitations. Companies should supplement the BCG Matrix with additional strategic tools and market insights to make well-rounded decisions that align with their overall business objectives and changing market dynamics.
Continue Your Learning Journey
Learning is a continuous process. Explore related topics, practical guides, tools, calculators, templates, and learning resources to expand your knowledge and develop new skills.
Choose a category below to explore practical tutorials, tools, calculators, templates, case studies, and learning resources.
Recommended Learning Resources
Expert-led courses to build practical skills, earn credentials, and advance your career.
Recommended professional books, certification guides, and practical study resources.
Ready-to-use templates, checklists, guides, and workbooks for practical applications.
Interactive calculators for statistics, quality, engineering, analysis, and decision-making.
Interactive Z, t, Chi-Square, and F tables with critical values and distribution curves.
Discover practical tutorials, case studies, and professional resources across Quality, Lean Six Sigma, Project Management, Statistics, AI, and Data Analytics.
Published: June 20, 2021
Last Updated: September 18, 2026