
If you have ever looked at a company and wondered why it keeps pouring money into one product while quietly letting another disappear, you are asking the same question that strategy teams ask in boardrooms every day: where should the business invest, where should it hold back, and what should it stop doing? That question sounds simple, but when a company sells many products, serves many markets, or runs multiple business units, the answer becomes surprisingly difficult.
This is where the BCG Matrix becomes useful.
What makes the BCG Matrix so interesting is that it does not just classify products into neat boxes for the sake of analysis. It gives managers a way to think about cash, growth, leadership, risk, and long-term survival. A fast-growing product may look exciting, but if it does not have a strong competitive position, it can become a dangerous cash drain. A mature product may look boring, but it might quietly be funding the future of the whole company. A weak product in a weak market may still survive for years if it supports something else. In other words, the BCG Matrix is not only about labels; it is about strategic trade-offs.
In this article, you will learn what the BCG Matrix is, how it works, where it came from, how to calculate its core measures, and how to use it in a practical step-by-step way. You will also see how the four famous quadrants—Stars, Cash Cows, Question Marks, and Dogs—work in real life. We will go beyond textbook definitions and explore everyday examples, decision traps, common mistakes, and a story-based case study so the ideas feel practical rather than academic.
The goal is simple: by the end of this guide, you should be able to look at a company’s product portfolio and say with confidence, ‘I understand why some products deserve investment, why some should be maintained, why some need a bet, and why some may need to go.
What is the BCG Matrix?
BCG matrix which is also known as Boston Consulting group matrix was developed in 1970s. It is a planning tool to plot company’s offering or services in four different quadrants or in square matrix by identifying your product lines and what you should do with them? It is also known as Growth-share matrix. It is used by company to decide what SBU’s we should keep and invest more, which one they should sell or divest.
The BCG Matrix was popularized by Bruce Henderson of the Boston Consulting Group in 1970 through his essay The Product Portfolio. BCG explains that the growth-share matrix emerged through a collaborative effort: Alan Zakon first sketched the idea, and the concept was then refined and popularized inside BCG. The framework was designed to solve a very practical problem: how should diversified companies allocate limited cash across many different businesses or product lines?
A good way to understand the BCG Matrix is to imagine a family budget. One family member earns consistent income every month. Another is studying and needs support but may earn well in the future. Another is starting a risky venture that could either succeed or fail. Another has expenses but no clear future payoff. A smart household would not spend on all four in the same way. Businesses face the same challenge. The BCG Matrix gives them a visual way to think about that challenge.
Before we understand how to construct BCG Matrix lets understand these terms first
1) Market growth rate
2) Relative Market Share
3) SBU (Strategic Business Units).
The thinking behind the model linked two ideas. First, businesses with high relative market share often enjoy scale advantages, which can support stronger returns. Second, high-growth markets often consume cash because companies need investment to grow and defend position. By putting those two ideas together, the matrix created a simple but powerful way to discuss strategy: Which products are likely to generate cash? Which products need cash? Which products deserve more investment? Which ones should be harvested or exited?
One reason the framework survived for decades is that it reduced strategic complexity into a visual story that executives could use quickly. BCG has stated that at the height of its influence, the growth-share matrix was used by about half of Fortune 500 companies. Even today, although business environments are more complex and digital markets move faster, the matrix remains widely taught because it is an effective starting point for portfolio thinking.
That phrase—starting point—is important. The BCG Matrix was never meant to replace managerial judgment, market research, or financial analysis. It was meant to simplify a difficult strategic conversation enough that leaders could begin asking the right questions. That is still exactly why it matters.
How the BCG Matrix Works
The Two Core Axes of the BCG Matrix
1) Market Growth Rate:
Market growth rate measures how quickly the overall market is expanding.
A high-growth market generally signals opportunity. Demand may be rising, new customers may be entering, and the category may still be gaining attention. But high growth also means a company often needs to spend aggressively—on production, marketing, distribution, talent, or technology—to remain competitive.
A low-growth market usually suggests that the category is mature. Demand may still be strong, but the explosive expansion phase is over. This does not necessarily mean the market is unattractive. In fact, low-growth markets can contain the most profitable products in a company’s portfolio if those products already hold leading positions and do not require massive reinvestment.
This is the 1st Variable n Y- axis is is the Market Growth Rate. It is the rate at which a market’s size is growing. We can figure out the market growth rate from industry reports, which are usually available online. So the formulae to calculate Market growth rate is
Market Growth Rate = Total sales in current year / Total sales in previous year
Say for examples if your company’s sales is growing by 15%, but the industry is growing by 20%, you are lagging behind your competition by 5% or Industry is growing at 12%, then you are leading ahead of your competition by 3%. Competition is very severe in markets that has low growth. Now every company is fighting to get some share in the fixed pie.
2) Relative Market Share :
Relative market share compares your market share with the market share of your largest competitor. This is one of the most important parts of the BCG Matrix because it is not asking, ‘What is our share in isolation?’ It is asking, ‘How strong are we compared with the strongest rival?’ That comparison matters because strategy is rarely won in a vacuum.
A relative market share above 1.0 means you are ahead of the largest competitor. A relative market share below 1.0 means the largest competitor is ahead of you. This is why the horizontal midpoint in many BCG matrices is set at 1.0.
The 2nd variable on X- axis is the Relative Market share. One such assumption that we take in BCG matrix is that if a company has very good market share then it is successful from a financial standpoint. Market share is generally expressed as a percentage and to have high market share, you generally have to be in market for a very long time, have been benefited from economies of scale and customers have purchased your products and have been somewhat satisfied if you’re going to generate high market share.
Market share is defined in terms of the percentage of your company in the industry that is measured either in revenue terms or unit volume terms. So the formulae to calculate market share is :
Market share = ( Company’s Total sales / Total Industry Sales) * 100
Say for example, let’s say that the total sales in your industry were $10 million last year. Your company sales total sales is $100,000. The to calculate market share we have $100,000 / $10 million. It come to .01 and If we multiply this by 100, you find that your market share is 1%.
3) Strategic Business Unit (SBU)
SBU is an independent fully functional business unit which has its own vision and mission goal and objectives. They have their own functions like HR, Finance, Operations etc.
Four BCG Matrix Quadrants & How to construct BCG matrix:
Stars: High Growth, High Relative Market Share
Stars are the products or business units everyone loves to talk about. They are winning in markets that are still growing fast. That is exciting because they sit at the intersection of opportunity and strength. They have leadership or near-leadership in a category that is still expanding. But Stars are not easy money. They often demand continued investment to defend position, expand capacity, maintain innovation, and respond to competition. A Star may generate strong revenue and even strong profits, but it can still absorb large amounts of cash because growth is expensive. That is why stars must be managed actively rather than admired from a distance.
The dream is that a Star eventually becomes a Cash Cow. In other words, once market growth slows down, the product continues to hold its leadership position and starts generating more cash than it consumes. That transition is one of the most satisfying stories in portfolio strategy. A simple everyday analogy would be a student who is highly talented and has just entered a field with huge potential. That student needs investment—education, coaching, time, and support—but could become a major earner in the future.
Cash Cows: Low Growth, High Relative Market Share
Cash Cows are the quiet financial backbone of many businesses. These products operate in mature or slower-growing markets, but they hold strong market positions. Because growth is slower, they usually do not need the same level of investment as Stars. That means they often generate more cash than they consume.
In practical terms, Cash Cows are the products management should protect, optimize, and ‘milk’ carefully. The idea of milking does not mean neglect. It means extracting steady value while avoiding unnecessary overinvestment. A company often uses the cash produced by these businesses to fund stars and selected question marks.
Many companies make a dangerous mistake here. Because a Cash Cow seems stable and less exciting than a Star, management sometimes pays too little attention to it. But if a business loses discipline around its cash cows—through sloppy pricing, weak customer service, or unnecessary product complexity—it can damage the very source of funding that supports future growth. An everyday analogy is a well-established rental property that does not grow quickly in value every month but produces consistent income. It may not be glamorous, yet it keeps the household financially healthy.
Question Marks: High Growth, Low Relative Market Share
Question Marks are where strategy becomes uncomfortable. These products are in attractive, growing markets, but the company does not yet have a strong market position. That means they could become Stars if the company invests wisely and execution goes well. But they could just as easily fail and turn into Dogs when market growth slows.
Question Marks usually consume cash rather than generate it. They can require serious marketing spend, distribution expansion, product development, talent, and management attention. Because of that, companies cannot afford to treat every question mark as a future champion. The real strategic challenge is selection. Which question marks deserve a bold bet, and which ones should be exited before they drain resources?
This is often where emotional decision-making enters the room. Teams fall in love with possibilities. New products sound exciting. Trendy categories create fear of missing out. But the BCG Matrix forces a sharper question: is this product really likely to win, or are we just hoping it will?
A useful life analogy is a promising side business. It operates in a growing area, and friends keep saying it could become something big, but right now it takes time and money and has not yet proven its strength. That does not make it a bad idea. It simply means it needs an honest decision.
Dogs: Low Growth, Low Relative Market Share
Dogs are products or business units with weak market position in slow-growth markets. In the original BCG language, these were often seen as poor places to invest because they neither generated much cash nor offered meaningful future potential.
However, in real life, the Dog category needs more nuance than many beginner articles admit. Some Dogs are truly weak and should be divested, discontinued, or liquidated. Others may still play support roles. A small product might be strategically useful because it protects a customer relationship, complements a larger product, supports a channel presence, or blocks a competitor. So while Dogs often face retrenchment, they should never be judged automatically without deeper context.
That said, many companies keep Dogs alive for the wrong reasons: internal politics, nostalgia, sunk-cost thinking, or fear of admitting failure. These are dangerous reasons to keep investing. If a product sits in a weak market, contributes little, and offers no strategic benefit, continuing to fund it can quietly reduce the company’s ability to invest in the future.
A daily life analogy would be a subscription you no longer use. It is not helping you grow, it is not making you money, and it still takes resources. At some point, the smartest move is simply to cancel it.
How to construct BCG Matrix ?
- First construct a square matrix of 2×2 .
- On the Y-axis we list Market growth rate and on X-axis we list Market share.
- Now add SBU’s as “Star, Cash Cows, Question Mark, Dog) in each of these four quadrants based on following :
- Stars in the Upper Left matrix. They are the one whose both market share and growth rate are high. Company’s ultimate goal is to keep all it’s products in Star. But more star means more expenses. In addition, the stars lead to a large amount of cash generation and cash consumption. Therefore, an attempt should be made to maintain market share and support further growth; otherwise, a star will become a cash cow.
- Cash Cows in the lower left matrix. They are those whose market share is high but Growth rate is low. It means you can take money from here and can invest somewhere else. Basically, cash cows of company helps in investing like Stars. Maturity phase of product generally come under cow. I case of cash cows you usually engage in a harvest strategy which means we will reduce financial support. The product is now already going to sell by itself. It makes no sense if we still continue to put more money into it. Instead, we should focus on generating as much cash inflow as possible. Companies in this category generally follow stability strategies. In addition, these companies required little investment and generate cash that can be used for investment in other business units.
- Question marks in upper right matrix. They are also called problem children because they generally are problematic. They are those whose market share is low but their growth rate is high. Because we don’t know much about them and how they are going to behave in the future. Now when you are introducing a new product in the market, they are generally placed in question marks because you will introduce new product in the growing market, but you are not aware of its market share. Maybe you shift from question mark to star but directly shift is rare. But generally, it has seen that one in question mark has the potential to enter Star.
- Dogs in the lower right matrix. They are the one whose both market share and growth rate are low. Declining phase of product generally come under dog. It means you should not invest more in Dog’s. What will you do after spending money on it? Remove the products in dog category. They’re sucking up a lot of cash. We don’t necessarily want to invest in them. But why would anybody have a dog in their portfolio anyway? Well, the thing is, is it’s not always starting out as a dog. Think about it. Sometimes it’s a question mark that doesn’t work out and becomes a dog, or sometimes products cycle through. I mean, think about the first PlayStation. When it came out. It was a total question mark because the console gaming industry was growing like crazy. And then we didn’t know we’re going to be and it started off as a small time player.
- Now place your products or SBU’s in either of these four quadrants based on their position with respect to Market growth rate and Market share.
10 Real-life BCG matrix example for Students
- BCG Matrix of Apple
- BCG Matrix of Coca-Cola
- BCG Matrix of Nestle
Apple BCG matrix / BCG Matrix of Apple Company:

Apple has lot of products from iPhone to Laptops to iPod and many more.
Lets plot the BCG matrix of Apple company.
Star: iPhone is Apple’s cash cow and has higher return on assets than its market growth rate therefore Apple can invest the excess cash generated in other projects or products.
Question mark: Apple are now introducing Apple Smart TV’s.
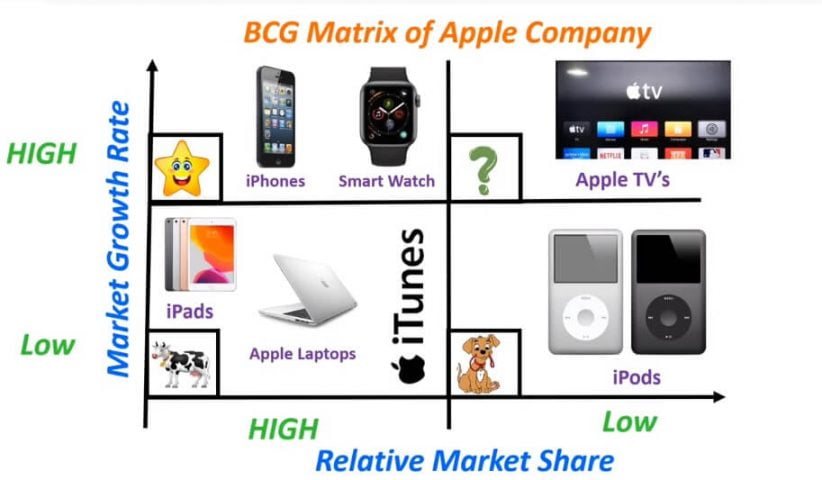
Cash Cows: iPads, 10 years ago when it first came out was a star for Apple but not now. Apple’s MacBook has steady market share and revenue, which make MacBook a cash cow for the Apple.
Dogs: iPods at one time as the best thing that they have invented at that time but Apple fails to make this a successful product
Coca Cola BCG Matrix Analysis/ BCG Matrix of Coca-Cola

- Stars: Coca-Cola is a star product with a high market growth rate and a high market share. It is the company’s flagship product and generates a lot of revenue. Coca-Cola needs to continue to invest in its stars to help them maintain their market share and grow even faster.
- Cash Cows: Sprite, Fanta, and Dasani are cash cow products with a low market growth rate and a high market share. These products are mature and generate a lot of cash flow for the company. Coca-Cola can use this cash flow to invest in new products or services, or to acquire other companies.
- Question Marks (Problem Child): Powerade and Minute Maid are question mark products with a high market growth rate and a low market share. These products are new and require a lot of investment to grow their market share. Coca-Cola needs to decide which question marks are worth investing in and which ones should be discontinued.
- Dogs: Coca-Cola Zero and Vitamin water are dog products with a low market growth rate and a low market share. These products are declining and may be discontinued. Coca-Cola needs to decide whether to discontinue these products or to invest in them in an attempt to turn them around.

Nestle BCG Matrix Analysis / BCG matrix of Nestle
- Stars: Nespresso, Nescafé, and KitKat are star products with a high market growth rate and a high market share. They are the company’s flagship brands and generate a lot of revenue.
- Cash cows: Maggi, Nesquick, and Nestlé Pure Life are cash cow products with a low market growth rate and a high market share. These products are mature and generate a lot of cash flow for the company.
- Question marks: Nesquik Cereal, Nespresso Vertuo, and Starbucks Coffee are question mark products with a high market growth rate and a low market share. These products are new and require a lot of investment to grow their market share.
- Dogs: Nestlé Toll House, Nestlé Crunch, and Milkybar are dog products with a low market growth rate and a low market share. These products are declining and may be discontinued.

Cadbury BCG matrix / BCG matrix of Cadbury
- Stars: Dairy Milk and Cadbury Dairy Milk Silk are star products with a high market growth rate and a high market share. They are the company’s flagship brands and generate a lot of revenue.
- Cash cows: Cadbury Dairy Milk Caramel, Cadbury Dairy Milk Oreo, and Cadbury Dairy Milk Crunchie are cash cow products with a low market growth rate and a high market share. These products are mature and generate a lot of cash flow for the company.
- Question marks: Cadbury Dairy Milk Bubbly, Cadbury Dairy Milk Caramello, and Cadbury Dairy Milk Oreo Cookies and Cream are question mark products with a high market growth rate and a low market share. These products are new and require a lot of investment to grow their market share.
- Dogs: Cadbury Fruit & Nut, Cadbury Dairy Milk White Chocolate, and Cadbury Dairy Milk Whole Nut are dog products with a low market growth rate and a low market share. These products are declining and may be discontinued.
Limitations of a BCG matrix
Below are some of the key limitations of the BCG Matrix:
- Oversimplification: One of the primary limitations of the BCG Matrix is its oversimplification of the market dynamics. By categorizing products into only four quadrants based on market growth rate and relative market share, the model overlooks the complexities and nuances of the market environment.
- Incomplete Analysis: The BCG Matrix considers only two factors, market growth rate, and relative market share, while ignoring other crucial variables, such as competition, customer preferences, technological advancements, and macroeconomic factors.
- Historical Focus: The BCG Matrix relies heavily on historical data, analyzing a product’s past performance rather than providing insights into its future potential. In rapidly changing markets, past performance may not accurately reflect future prospects.
- Lack of Market Dynamics: The BCG Matrix does not account for the pace at which markets evolve or how quickly a product’s position may change. In dynamic industries, the model’s static analysis may lead to inaccurate strategic recommendations.
- Subjective Market Definitions: Defining the market and calculating market share can be subjective and may vary depending on the chosen criteria. Different market definitions can lead to varying assessments of a product’s position.
- Ignores Synergy: The BCG Matrix evaluates products in isolation, disregarding potential synergies and interdependencies among products within a company’s portfolio. A product considered a “dog” alone may add value when combined with other offerings.
- Limited Guidance on Strategy: While the BCG Matrix classifies products into different categories, it does not provide specific guidance on the appropriate strategies for each category. Companies need to devise strategies separately for investment, divestment, or repositioning decisions.
- Not Suitable for Diverse Businesses: The BCG Matrix is most effective for businesses with a single core market. Companies with diverse product lines or operating in multiple industries may find it challenging to use the matrix effectively.
- Neglects Non-Market Factors: The model does not account for non-market factors, such as social, environmental, and ethical considerations, which are becoming increasingly important for businesses today.
- Limited Application Beyond Products: The BCG Matrix is primarily designed for analyzing products and does not address other aspects of a company’s business, such as services, partnerships, or digital initiatives.
Despite its limitations, the BCG matrix can be a useful tool for businesses to get a broad overview of their portfolio and make strategic decisions about resource allocation. Lets look at some benefits of a BCG matrix.
Benefits of a BCG matrix.
- Portfolio Analysis: The BCG Matrix allows companies to comprehensively analyze their product portfolio by categorizing products into four quadrants based on their market growth rate and relative market share. This segmentation offers a clear overview of each product’s performance and potential.
- Resource Allocation: By classifying products into different quadrants, such as Stars, Cash Cows, Question Marks, and Dogs, the BCG Matrix aids in effective resource allocation. It helps businesses prioritize investments, allocate budgets, and align resources with strategic goals.
- Decision-Making Support: The BCG Matrix simplifies complex data and presents it visually, making it easier for decision-makers to understand the current and future prospects of products. It facilitates strategic decision-making by providing a structured framework.
- Strategic Direction: With insights from the BCG Matrix, companies can identify growth drivers (Stars) and steady revenue generators (Cash Cows) within their portfolio. This enables the alignment of strategic priorities with business objectives.
- Market Positioning: The BCG Matrix helps identify products with growth potential (Question Marks) and those that may require divestment or repositioning (Dogs). This enables businesses to seize new opportunities and optimize their market positioning.
- Risk Management: By diversifying their product portfolio, companies can manage risk effectively. The BCG Matrix encourages a balanced mix of products, reducing exposure to potential losses from underperforming products.
- Competitive Benchmarking: The BCG Matrix facilitates benchmarking against competitors, allowing businesses to compare their product portfolio’s performance with industry best practices. It helps identify areas for improvement and potential competitive advantages.
- Communication: The BCG Matrix provides a straightforward and concise way to communicate product performance to stakeholders, fostering a common understanding among executives, investors, and employees.
- Efficient Resource Utilization: Focusing resources on high-potential products (Stars and Question Marks) optimizes resource utilization and avoids wasting investments on products with limited growth prospects.
- Continuous Monitoring: The dynamic nature of the BCG Matrix encourages companies to continually monitor and reassess their product portfolio. This promotes proactive adjustments to strategic plans based on changing market conditions.
- Flexibility: The BCG Matrix can be adapted to suit different industries, businesses, or even other elements of a company’s operations, beyond just products.
Frequently Asked Questions About the BCG Matrix
1. What is the BCG Matrix in simple words?
The BCG Matrix is a business tool that helps companies decide where to invest, where to maintain, and what to stop by comparing market growth and relative market share.
2. What does BCG stand for?
BCG stands for Boston Consulting Group, the consulting firm associated with the framework.
3. Who created the BCG Matrix?
BCG states that Alan Zakon first sketched the idea and Bruce Henderson popularized it in 1970 through the essay The Product Portfolio.
4. What are the four quadrants of the BCG Matrix?
The four quadrants are Stars, Cash Cows, Question Marks, and Dogs.
5. What is the purpose of the BCG Matrix?
Its purpose is to analyze a portfolio of products or business units and support better investment and resource-allocation decisions.
6. What is a Star in the BCG Matrix?
A Star is a product with high market share in a high-growth market. It has strong potential but usually still needs investment.
7. What is a Cash Cow in the BCG Matrix?
A Cash Cow is a product with high market share in a low-growth market. It often generates more cash than it needs and can fund other parts of the portfolio.
8. How do you calculate relative market share?
Relative market share is calculated by dividing your market share by the market share of your largest competitor.
9.How do you calculate market growth rate for the matrix?
A simple method is to compare current market size with previous market size and convert the change into a percentage.
10. Where should a company invest most?
Usually in Stars and selected Question Marks with a real chance of becoming leaders, while protecting strong Cash Cows and avoiding wasteful support of weak units.
Conclusion
In conclusion, while the BCG Matrix remains a valuable tool for assessing a company’s product portfolio, it is crucial to be aware of its limitations. Companies should supplement the BCG Matrix with additional strategic tools and market insights to make well-rounded decisions that align with their overall business objectives and changing market dynamics.
Watch this animated YouTube video for details :
📚 Where Should I Go After Learning This Project Management Concept?
Learning one project management concept is only the first step toward becoming an effective project manager. Successful projects require understanding how different project management tools, techniques, and frameworks work together throughout the project lifecycle.
Continue your learning journey with these practical guides on Digital E-Learning to strengthen your knowledge of Project Management, PMP®, Agile, Planning, Scheduling, Risk Management, and Team Leadership.
- Pugh Matrix or Decision Matrix Method
- What Is Kanban?
- Network Diagram in Project Management
- RACI matrix
- SWOT Analysis With Examples & Case Study?
- Mission Vision Goals and Objectives
- BCG (Boston Consulting Group) Matrix
About the Author
Aman is the Founder of Digital E-Learning and a Quality & Continuous Improvement professional with more than 25 years of experience across the Automotive, Medical Device, Manufacturing, and Consulting industries. Throughout his career, he has led and contributed to numerous initiatives in Lean Six Sigma, Quality Engineering, Risk Management, Design Assurance, Process Improvement, Problem Solving, and Operational Excellence, helping organizations enhance quality, improve efficiency, and deliver greater customer value.
Drawing on extensive real-world industry experience, Aman focuses on simplifying complex concepts into practical, easy-to-understand learning resources. His content combines proven methodologies, industry best practices, and hands-on examples to help students, engineers, quality professionals, and business leaders apply these concepts effectively in their day-to-day work.
In addition to his professional experience, Aman is the creator of the Digital E-Learning YouTube channel, a trusted learning platform followed by over 100,000 subscribers worldwide. Through his articles and videos, he shares practical knowledge in Lean Manufacturing, Six Sigma, Quality Management, Statistics, Microsoft Excel, Project Management, and Continuous Improvement.
Published: June 20, 2021
Last Updated: July 11, 2026


