
Network Diagram AON vs. AOA in Project Management: How to Identify Critical Paths, Avoid Delays, and Eliminate Bottlenecks
Successful project execution depends on more than defining goals and assigning tasks. As projects grow in complexity, teams must coordinate multiple activities, resources, milestones, and deadlines while ensuring that work progresses in a logical and efficient manner. Without a structured way to visualize these relationships, project schedules can quickly become difficult to manage.
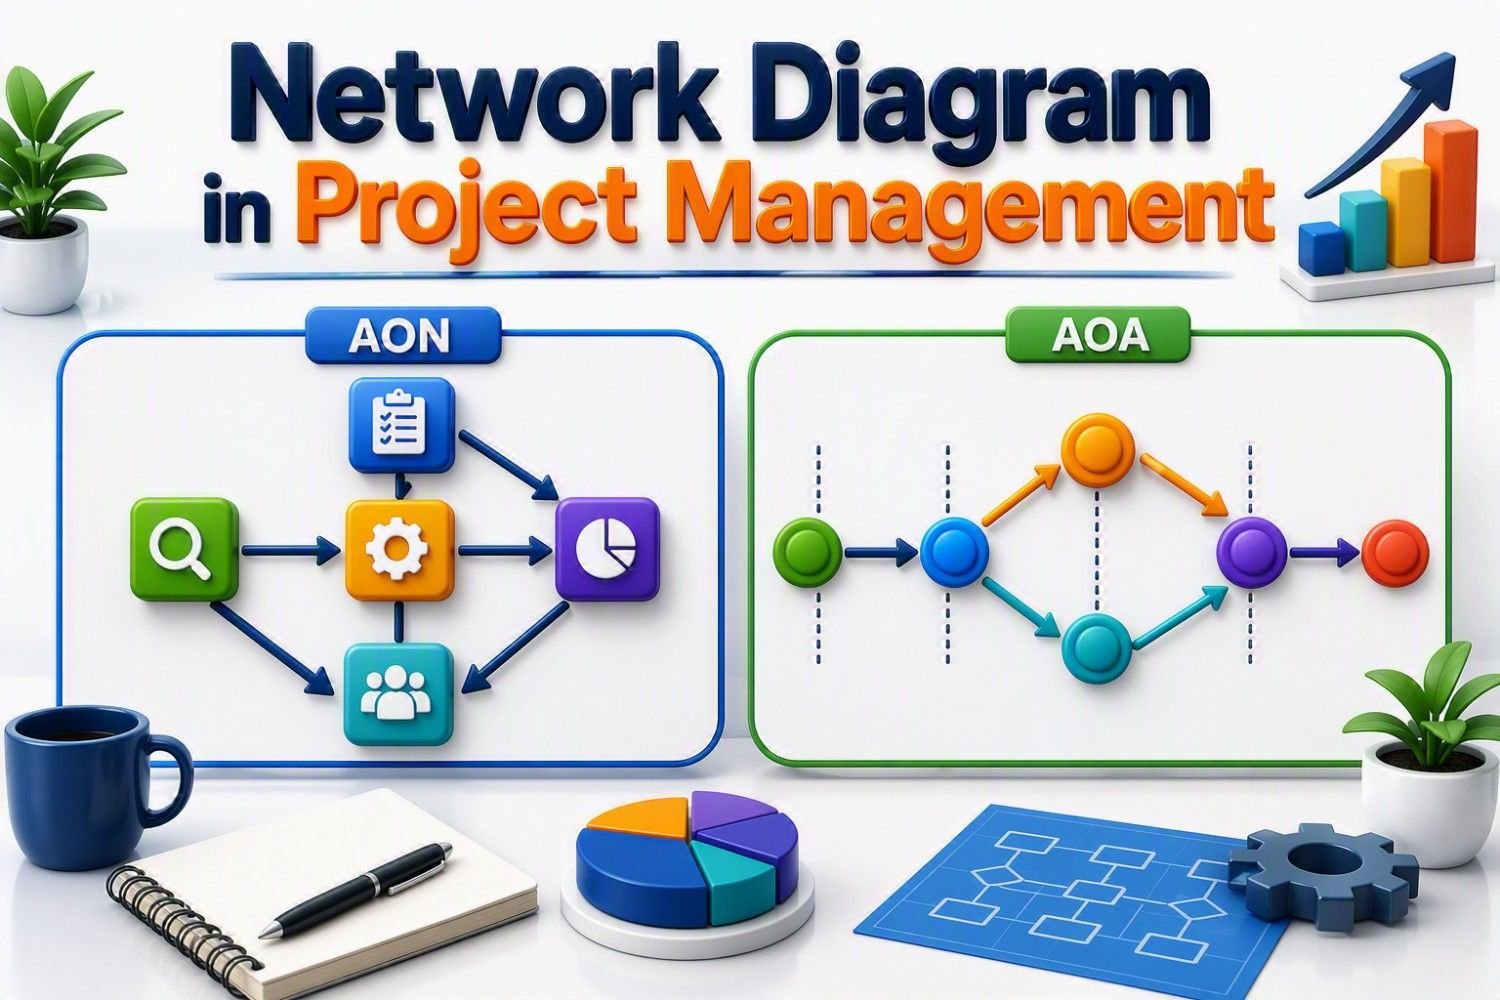
Project managers often need tools that provide a clear picture of how project activities are organized and connected. Visual planning techniques help simplify complexity, improve communication among stakeholders, and support better decision-making throughout the project lifecycle. Among the most effective planning and scheduling tools used in project management are network diagrams. By visually representing project activities and their relationships, network diagrams help teams organize work, improve schedule transparency, and manage projects with greater confidence and control.
In this guide, you’ll learn how network diagrams support project planning, the differences between AON and AOA approaches, and how these techniques help project teams improve schedule visibility, resource coordination, and overall project execution.
Why Every Successful Project Starts with a Network Diagram
Every successful project starts with clarity, and that is exactly where a network diagram becomes valuable. In my own project experience, I have seen that delays rarely happen because people are not working hard; they usually happen because the sequence of work is not clearly understood. One small dependency missed during planning can quietly create a chain reaction later. A network diagram helps project managers see the full flow of activities before execution begins—what must happen first, which tasks can run in parallel, where the critical path sits, and which activity has no room for delay.

Instead of managing the project only through task lists or status meetings, the project manager gets a visual roadmap of how work actually moves from start to finish. This makes it easier to identify bottlenecks early, assign resources more wisely, and take action before a delay turns into a bigger project issue. For me, the biggest advantage of using a network diagram is that it changes project planning from guesswork into structured thinking. It forces the team to ask practical questions: “What depends on this?”, “What happens if this task slips?”, and “Which activity can delay the entire project?” That is why a network diagram is not just a planning tool; it is a prevention tool. It helps project managers protect timelines, reduce confusion, improve communication, and give stakeholders more confidence that the project is being controlled with logic rather than assumptions.
What is a Network Diagram in Project Management?
A network diagram in project management is a visual representation of all the activities required to complete a project and the relationships between those activities. Instead of looking at tasks as separate items on a checklist, a network diagram shows how each task connects to the next, which activities can occur simultaneously, and which tasks must be completed before others can begin. Think of it as a roadmap for your project that reveals the most efficient path from start to finish while highlighting potential risks before work even begins.
When I first heard the term Network Diagram, I mistakenly thought it was something related to computer networking. It wasn’t until I started leading larger manufacturing and process improvement projects that I discovered its real value. I realized that successful projects aren’t driven by a list of tasks—they’re driven by understanding how those tasks depend on one another. Since then, creating a network diagram has become one of the first things I do before building a project schedule.
A typical network diagram consists of activities (tasks), milestones, nodes, and connecting arrows. The nodes represent project activities, while the arrows show the logical sequence and dependencies between them. By mapping these relationships, project managers can identify the critical path—the sequence of tasks that directly determines the project’s completion date. Any delay on a critical path activity can delay the entire project, which is why understanding these relationships is so important.
Why Network Diagrams are Important for Project Managers
From my own experience managing process improvement and cross-functional projects, I have found that network diagrams often reveal risks that are invisible in traditional task lists or spreadsheets. A project schedule may look realistic on paper, but once the dependencies are mapped visually, hidden constraints and resource conflicts start to emerge. This visibility helps project managers make smarter decisions early in the planning phase rather than scrambling to fix problems after execution has already started.
Another reason network diagrams are so important is their ability to identify the critical path—the sequence of activities that directly determines the project’s completion date. Knowing which tasks are critical allows project managers to focus their attention and resources where they matter most. Instead of treating every task with the same urgency, they can prioritize activities that have the greatest impact on project success. This targeted approach improves efficiency and reduces the likelihood of costly delays.
Key Benefits of Network Diagrams for Project Managers
- Provide a clear visual roadmap of project activities and dependencies.
- Identify the critical path and activities that directly impact project completion.
- Reduce scheduling risks by uncovering hidden dependencies early.
- Prevent project delays by highlighting tasks with little or no scheduling flexibility.
- Detect bottlenecks before they impact project performance.
- Improve resource allocation and workload planning.
- Enhance team communication through a shared understanding of project flow.
- Support better decision-making with a complete view of project relationships.
- Increase project predictability and confidence in delivery timelines.
- Improve stakeholder visibility into project progress and potential risks.
In simple terms, a network diagram gives project managers something every successful project needs: visibility. When you can clearly see how work flows, where risks exist, and which activities drive the schedule, managing a project becomes less about putting out fires and more about guiding the project toward a successful outcome.
🎓 Top-Rated Courses & Certifications
Try changing your filters or searching for another course.
Key Components of a Project Network Diagram
A project network diagram may look like a collection of boxes and arrows, but each element plays a specific role in helping project managers understand how work flows through a project. From my experience, many scheduling problems occur when teams focus only on individual tasks and overlook the relationships between them. Understanding the core components of a network diagram helps project managers visualize dependencies, predict scheduling risks, and develop more realistic project plans. The four fundamental components are activities, events (milestones), dependencies, and duration.
Activities
Activities are the individual tasks or pieces of work required to complete the project. Each activity consumes time, resources, or both, and is typically displayed as a box or node within the network diagram.Whenever I create a network diagram, I start by identifying all major activities because missing even one critical task can create scheduling surprises later in the project.
Events (Milestones)
Milestones represent significant points in the project, such as completing a project phase, receiving customer approval, or finishing product testing. Unlike activities, milestones have zero duration because they mark achievements rather than work. They help project managers track progress and confirm that the project is moving according to plan.
Dependencies
Dependencies define the relationships between activities and determine the order in which work must be performed. They answer an important project management question: What must happen before another task can begin? In my experience, most project bottlenecks can be traced back to poorly understood dependencies. Mapping these relationships early often prevents costly schedule disruptions later.
Duration
Duration is the estimated time required to complete each activity. Accurate duration estimates are essential because they determine the overall project schedule and help calculate the critical path. Unrealistic estimates can create inaccurate timelines, making it difficult to allocate resources and deliver the project on schedule.
Together, activities, milestones, dependencies, and duration create the backbone of a project network diagram. When these components are clearly defined, project managers can build realistic schedules, identify critical activities, anticipate bottlenecks, and make better decisions throughout the project lifecycle.
Types of Network Diagrams
Not all network diagrams are created the same way. Over the years, project management professionals have developed different approaches for visually representing project activities and their relationships. The two most widely recognized types are Activity on Node (AON) and Activity on Arrow (AOA). While both serve the same purpose—helping project managers visualize task sequences and dependencies—they differ in how project activities are displayed. Understanding these methods allows project managers to choose the most effective format for their projects and better interpret project schedules.
Activity on Node (AON)
Activity on Node (AON) is the most commonly used network diagram technique in modern project management. In this method, each project activity is represented by a node (box), while arrows are used to show the relationships and dependencies between activities. Because activities are displayed directly inside the nodes, AON diagrams are generally easier to read, create, and update than other network diagram formats.
In my experience, AON diagrams are particularly useful when managing complex projects with many parallel activities. They provide a clear visual view of the project workflow and make it easier to identify critical paths, scheduling risks, and resource constraints. Most project management software tools, including Microsoft Project and Primavera P6, use the AON format because of its simplicity and flexibility.
Key Characteristics of AON
- Activities are displayed as nodes (boxes).
- Arrows represent dependencies between activities.
- Easier to understand and maintain.
- Supports all common dependency types.
- Widely used in modern project scheduling software.
- Ideal for critical path analysis and project planning.
Activity on Arrow (AOA)
Activity on Arrow (AOA) is a traditional network diagram method in which activities are represented by arrows, while nodes represent events or milestones. Unlike AON, the focus is placed on the flow of activities rather than on the activities themselves.
AOA diagrams were widely used before modern project scheduling tools became popular. While they can effectively illustrate project flow, they often require the use of dummy activities—special arrows that do not represent actual work but are needed to maintain logical relationships within the diagram. These dummy activities can make large diagrams more difficult to interpret.
Although I rarely encounter AOA diagrams in day-to-day project management today, understanding them remains useful, especially for PMP certification studies and when reviewing older project documentation.
AON vs. AOA: Which One is Better?
For most modern projects, Activity on Node (AON) is generally preferred because it is easier to develop, easier to understand, and more adaptable to complex project schedules. However, both methods can effectively illustrate project activities and dependencies when used correctly.
📚 Recommended Books for Professionals
Try removing one or more filters.
Understanding Activity Dependencies
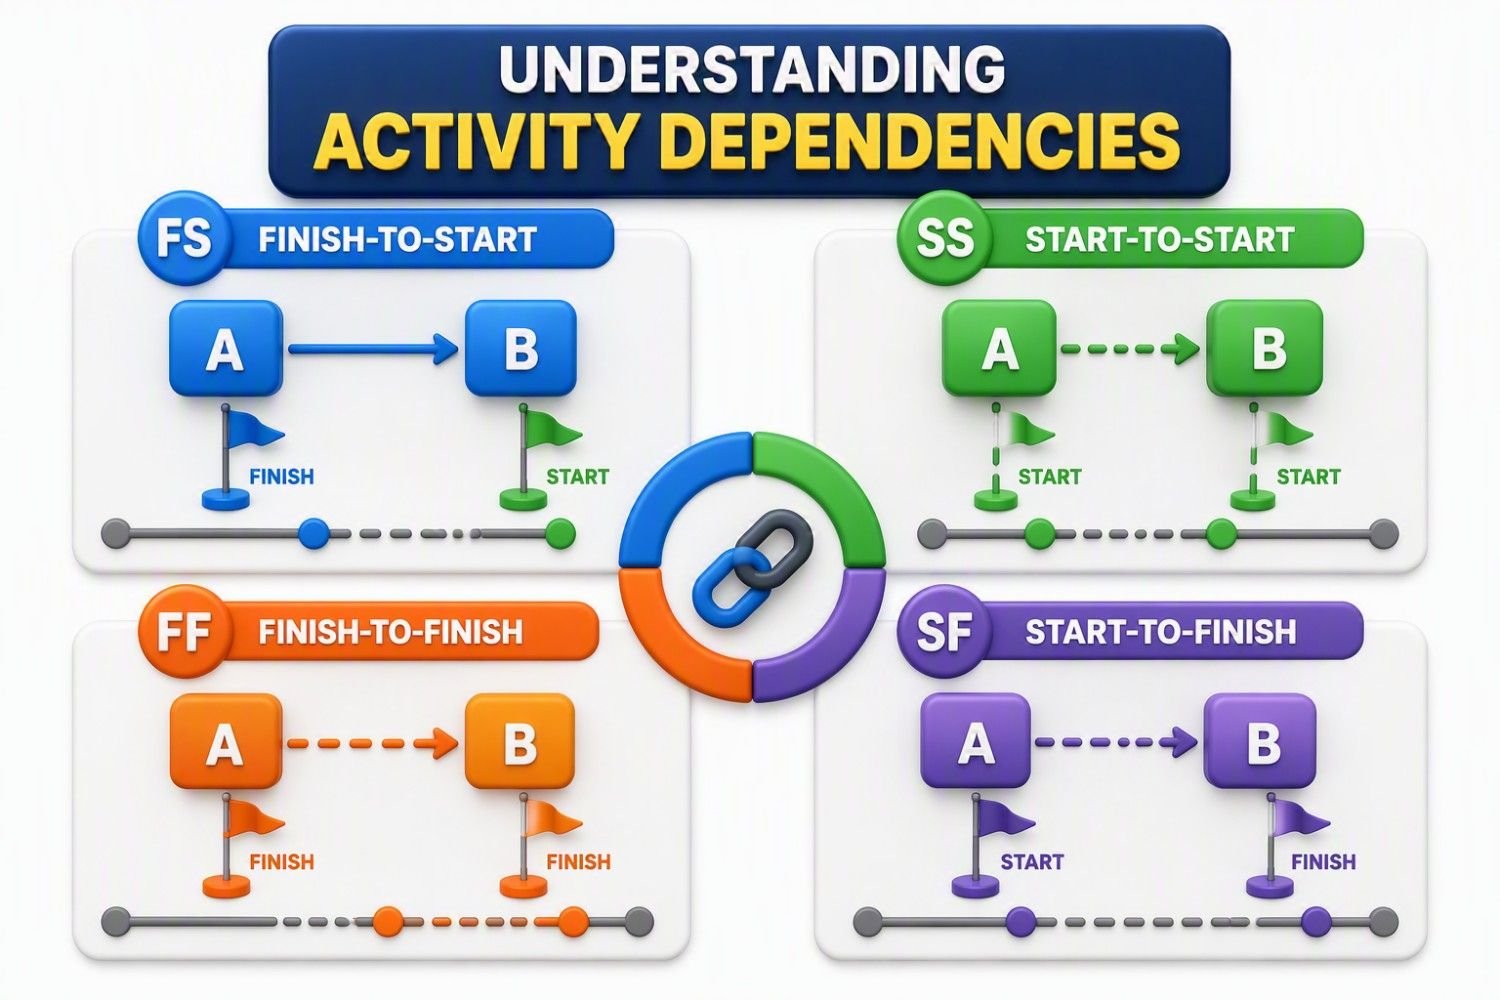
One of the most valuable benefits of a network diagram is its ability to show activity dependencies—the logical relationships that determine the order in which project tasks must be performed. In real-world projects, very few activities happen completely independently. Most tasks rely on the completion, initiation, or progress of another activity before they can move forward. Understanding these dependencies helps project managers build realistic schedules, identify potential risks, and prevent delays before they occur.
From my experience, many project schedule problems can be traced back to misunderstood dependencies rather than poor execution. A task may appear simple when viewed on its own, but once its relationship with other activities is considered, the impact on the overall project becomes much clearer. By mapping dependencies within a network diagram, project managers gain visibility into how work flows throughout the project and can make better planning decisions.
Finish-to-Start (FS)
Finish-to-Start (FS) is the most common dependency in project management. In this relationship, the successor activity cannot begin until the predecessor activity is completed. In my experience, most project schedules consist primarily of Finish-to-Start relationships because many work activities naturally follow a sequential order. Properly identifying FS dependencies helps project managers avoid unrealistic timelines and improves scheduling accuracy.
Start-to-Start (SS)
In a Start-to-Start (SS) relationship, the second activity can begin only after the first activity has started. Both activities may then continue simultaneously. I often use Start-to-Start relationships in process improvement projects where multiple teams can work concurrently. This approach can significantly reduce project duration when managed correctly.
Finish-to-Finish (FF)
In a Finish-to-Finish (FF) relationship, two activities may start at different times, but the successor activity cannot finish until the predecessor activity is complete. From my experience, FF dependencies are especially useful when managing approval processes, testing activities, or project closeout tasks where multiple deliverables must reach completion simultaneously.
Start-to-Finish (SF)
Start-to-Finish (SF) is the least common dependency and is rarely used in most projects. In this relationship, the successor activity cannot finish until the predecessor activity has started. Throughout my project management career, I have encountered SF dependencies far less frequently than FS, SS, or FF relationships. However, understanding them is important because they occasionally appear in staffing, operational, and transition-related projects.
Summary of Dependency Types
Understanding these four dependency types allows project managers to create more accurate network diagrams, develop realistic schedules, identify critical paths, and anticipate potential bottlenecks before they affect project performance. In my experience, mastering activity dependencies is one of the fastest ways to improve project planning because it reveals how work truly flows through a project rather than how we assume it flows.
How to Create a Network Diagram: Step-by-Step
Creating a network diagram may seem complicated at first, but once you break the process into manageable steps, it becomes one of the most powerful planning tools in project management. In my experience, the biggest mistake project teams make is jumping straight into scheduling software before fully understanding the relationships between their activities. A network diagram forces you to think through the project logically before execution begins, which helps uncover hidden risks, unrealistic assumptions, and potential bottlenecks. By following a structured approach, you can build a network diagram that provides a clear roadmap for successful project delivery.
Step 1 : Identify All Project Activities
The first step is to create a comprehensive list of all activities required to complete the project. These activities are typically identified from the project scope, Work Breakdown Structure (WBS), project charter, or planning sessions with stakeholders.
From my own projects, I have found that spending extra time on this step pays off later. Missing a critical activity can create significant scheduling problems once the project is underway. Focus on identifying meaningful work packages rather than tiny day-to-day tasks.
Step 2 : Determine Activity Dependencies
Once all activities have been identified, the next step is determining how they relate to one another. Ask questions such as:
- Which activities must be completed first?
- Which activities can occur simultaneously?
- What tasks are dependent on other tasks?
This step creates the logical flow of the project and forms the foundation of the network diagram.
Step 3: Estimate Activity Durations
Next, assign an estimated duration to each activity. Depending on the project, durations may be measured in:
- Hours
- Days
- Weeks
- Months
In my experience, the most reliable estimates come from historical project data and subject matter experts rather than assumptions. Accurate duration estimates are essential because they directly influence the project timeline and critical path calculation.
Step 4: Draw the Network Diagram
Now it's time to visually arrange the activities.
Using either the Activity on Node (AON) or Activity on Arrow (AOA) method, place activities in sequence and connect them using arrows that represent dependencies.
A simple example might look like:
Start → Requirements → Design → Development → Testing → Deployment → Finish
For more complex projects, multiple parallel paths may exist. When I create network diagrams, I usually start on a whiteboard before moving into software. This makes it easier to discuss dependencies with project team members and identify missing activities.
Step 5: Identify Parallel Activities
Not every activity has to wait for another activity to finish. Look for tasks that can occur simultaneously to reduce the overall project duration.
For example:
- User documentation may begin while product testing is underway.
- Training material development may proceed during final development activities.
Identifying parallel activities can significantly improve schedule efficiency and shorten project timelines.
Step 6: Calculate the Critical Path
Once the diagram is built, determine the critical path. The critical path is the longest sequence of dependent activities that determines the project's minimum completion time. Any delay in a critical path activity will delay the entire project. This step helps project managers focus their attention on the activities that matter most.
Step 7: Identify Float or Slack
After determining the critical path, identify activities that have scheduling flexibility. This flexibility is known as float or slack. Activities with float can be delayed without impacting the project's completion date, while critical path activities usually have zero float.
Step 8: Review for Bottlenecks and Risks
With the network diagram complete, evaluate it for potential bottlenecks. In my experience, this is where the real value of a network diagram becomes apparent. It allows project managers to proactively address problems before they become schedule delays.
Step 9: Update and Maintain the Diagram
A network diagram should not be treated as a one-time planning document. Regular updates ensure the network diagram remains an accurate reflection of the project and continues to provide value throughout execution.
Why Identifying the Critical Path Matters
The most valuable outcomes of creating a network diagram is identifying the critical path. The critical path is the longest sequence of dependent activities that determines the shortest possible time required to complete a project. In simple terms, if any activity on the critical path is delayed, the entire project will be delayed. This is why experienced project managers pay close attention to critical path activities—they represent the tasks that have the greatest impact on the project's completion date.
These activities directly determine whether the project finishes on time. If a critical task is delayed by three days, the entire project will likely be delayed by three days unless corrective action is taken.
Knowing the critical path helps project managers:
- Prioritize high-risk activities.
- Monitor project performance more effectively.
- Allocate resources where they have the greatest impact.
- Detect schedule threats early.
- Make informed decisions when delays occur.
- Improve project completion accuracy.
What is Float (Slack) and Why does it Matter?
One concept that completely changed how I managed project schedules was float, also known as slack. Early in my career, I assumed every task had to start and finish exactly as planned. In reality, I learned that some activities have built-in scheduling flexibility, while others have none at all. Knowing the difference helped me prioritize work more effectively and avoid unnecessary pressure on the team.
One concept that completely changed how I managed project schedules was float, also known as slack. Early in my career, I assumed every task had to start and finish exactly as planned. In reality, I learned that some activities have built-in scheduling flexibility, while others have none at all. Knowing the difference helped me prioritize work more effectively and avoid unnecessary pressure on the team.
Float (or Slack) is the amount of time an activity can be delayed without delaying the overall project completion date. In other words, it measures the scheduling flexibility available for a task. Activities with zero float are part of the critical path, meaning even a one-day delay can push back the entire project. Activities with positive float have some flexibility and can be rescheduled within their available slack without affecting the project's finish date.
The basic formula is:
Float = Latest Start Date − Earliest Start Date
or
Activities on the critical path have zero float, which means they cannot be delayed without delaying the entire project.
How Network Diagrams Help Avoid Delays and Bottlenecks
A single delayed activity unexpectedly affected several others, creating bottlenecks that were difficult and expensive to recover from. Since I started using network diagrams consistently, those surprises have become far less common because the entire workflow is visible from the beginning.
A network diagram clearly shows how every activity is connected, making it easier to identify the critical path, recognize task dependencies, and spot activities that have little or no scheduling flexibility. This visibility allows project managers to focus on the tasks that directly influence the project's completion date instead of treating every activity with the same level of urgency.
From my experience, most project delays happen because task dependencies aren't identified early. A network diagram solves this by showing how every activity connects, making it easy to spot the critical path, identify potential bottlenecks, and understand which tasks cannot be delayed. Instead of reacting to problems after they occur, project managers can adjust schedules, prioritize critical activities, and allocate resources more effectively. The result is better planning, smoother execution, fewer delays, and a much higher chance of delivering the project on time.
Network Diagram vs. Gantt Chart: What's the Difference?
If you have spent any time in project management, you have probably heard of both Network Diagrams and Gantt Charts. While these tools are often used together, they serve different purposes. One helps you understand how activities are connected, while the other helps you understand when activities will occur. In my experience, many project managers mistakenly treat them as interchangeable tools, but they answer two very different questions. A network diagram answers "What is the sequence of work?" whereas a Gantt chart answers "When will the work be completed?"
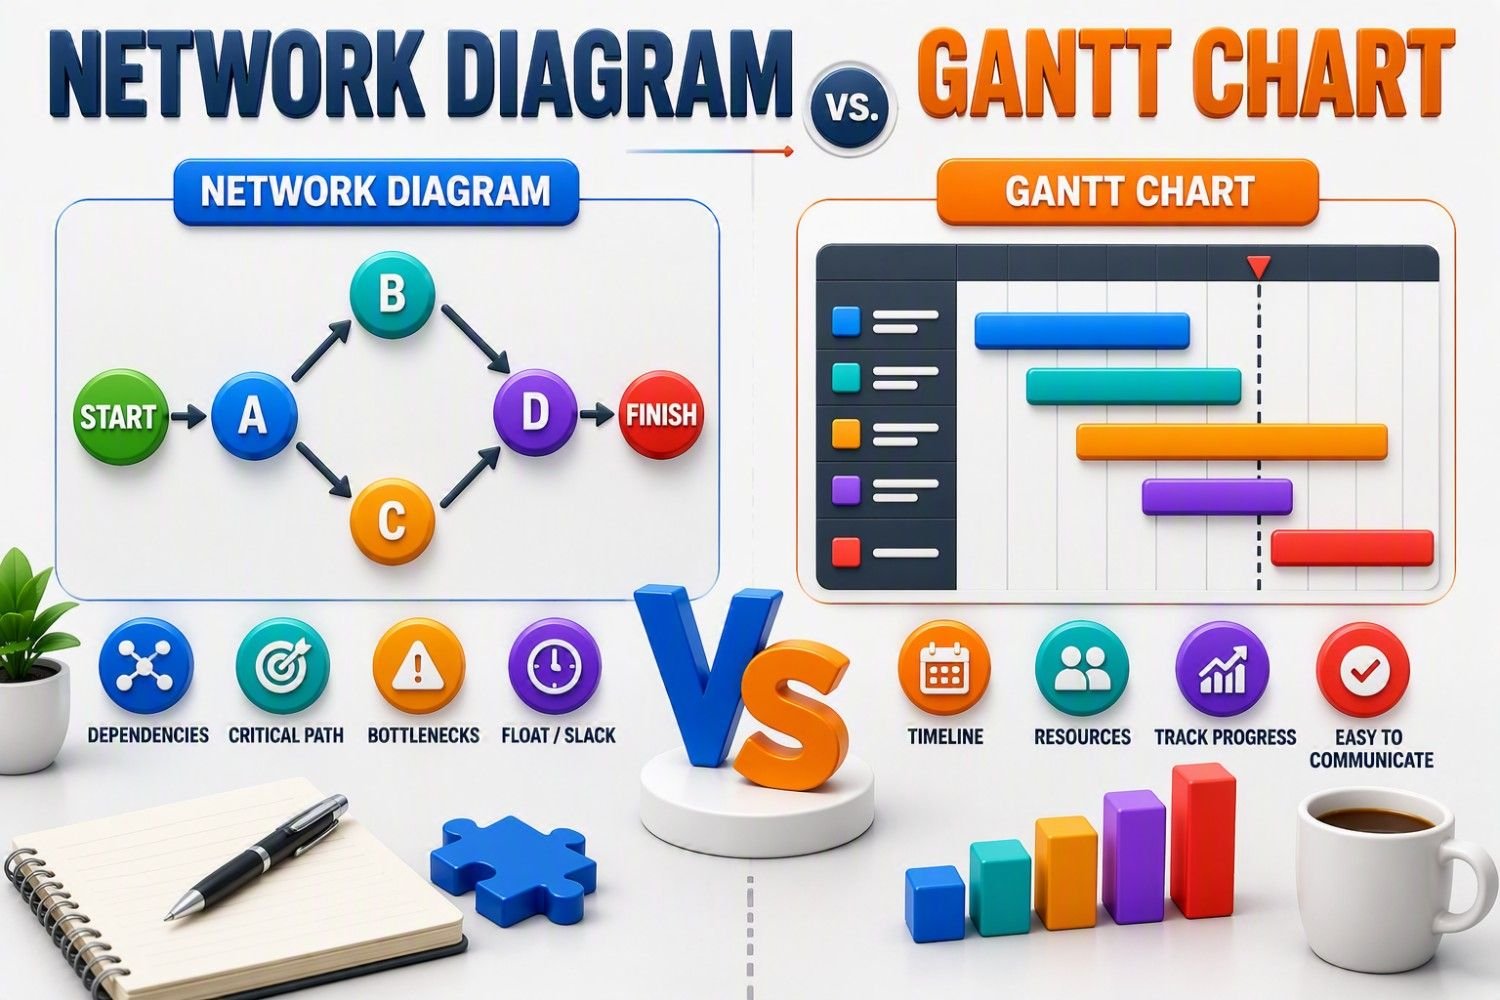
When I begin planning a complex project, I typically start with a network diagram because it forces the team to think through dependencies, critical paths, and bottlenecks. Once those relationships are clear, I convert that information into a Gantt chart to create a timeline that stakeholders can easily understand. Used together, these tools create a powerful combination for planning, scheduling, and controlling projects.
Key Differences Between Network Diagrams and Gantt Charts
Understanding dependencies is one of the most important aspects of network diagram development. While Activity-on-Node (AON) and Activity-on-Arrow (AOA) represent project logic differently, both methods can model the same dependency relationships and activity sequences.

Lean Six Sigma • Six Sigma • Statistics • Project Management • Artificial Intelligence (AI) • Operations Management • Quality Management
Frequently Asked Questions (FAQs)
What is a network diagram in project management?
A network diagram is a visual representation of project tasks and their dependencies.
Why is a network diagram important?
It helps plan, schedule, and manage task relationships efficiently.
What is the critical path?
The critical path is the longest sequence of tasks that determines project duration.
What is CPM in project management?
CPM is a method used to identify the critical path and optimize project timelines.
What is PERT used for?
PERT is used to estimate project time when activity durations are uncertain.
What is float or slack?
Float is the extra time a task can be delayed without affecting the project.
What is an AON network diagram?
AON represents tasks as nodes and dependencies as arrows.
What is an AOA network diagram?
AOA represents tasks as arrows and events as nodes.
How is a network diagram created?
It is created by listing tasks, defining dependencies, and connecting them logically.
What is the benefit of identifying the critical path?
It helps ensure the project is completed on time by focusing on critical tasks.
Continue Your Learning Journey
Learning is a continuous process. Explore related topics, practical guides, tools, calculators, templates, and learning resources to expand your knowledge and develop new skills.
Choose a category below to explore practical tutorials, tools, calculators, templates, case studies, and learning resources.
Recommended Learning Resources
Expert-led courses to build practical skills, earn credentials, and advance your career.
Recommended professional books, certification guides, and practical study resources.
Ready-to-use templates, checklists, guides, and workbooks for practical applications.
Interactive calculators for statistics, quality, engineering, analysis, and decision-making.
Interactive Z, t, Chi-Square, and F tables with critical values and distribution curves.
Discover practical tutorials, case studies, and professional resources across Quality, Lean Six Sigma, Project Management, Statistics, AI, and Data Analytics.
Published: June 18, 2021
Last Updated: September 18, 2026




I could not resist commenting. Exceptionally well written!