What is Process Capability (Cp & Cpk)? How World-Class Companies Predict defects before they happen
Imagine being able to identify potential quality problems before customers ever see them. High-performing organizations don’t rely on inspection alone to find defects. Instead, they use data to understand how consistently their processes perform and whether they are capable of meeting customer requirements over time.
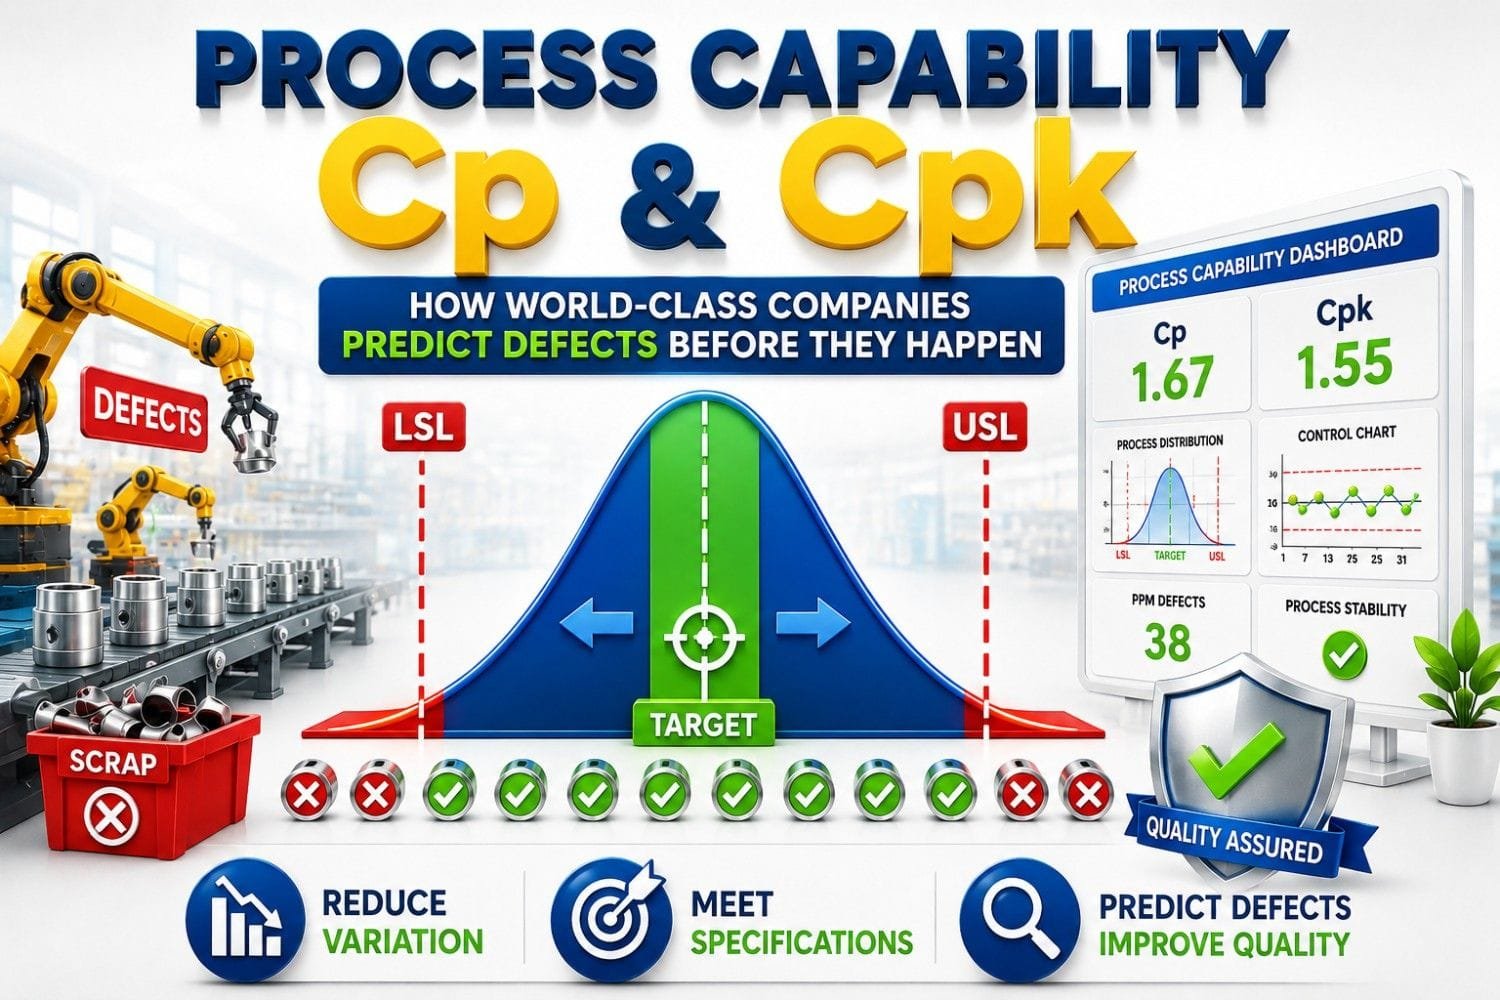
Companies that consistently deliver high quality products understand that reducing variation is often more important than increasing inspection. By measuring process capability, teams can make better decisions, improve performance, reduce waste, and build confidence that their processes will continue producing conforming products long before defects become customer complaints.
Why Some Processes Produce Defects and Others Don’t
It’s a question that has fascinated quality engineers for decades. Imagine walking through two manufacturing facilities producing identical precision components. Both use modern equipment, follow documented work instructions, purchase materials from qualified suppliers, and employ trained operators. On the surface, there seems to be very little separating them.
After 6-9 months, one facility is consistently shipping products that meet customer specifications with minimal scrap, rework, or customer complaints. The other is struggling with rising rejection rates, production delays, increasing manufacturing costs, and frustrated customers.
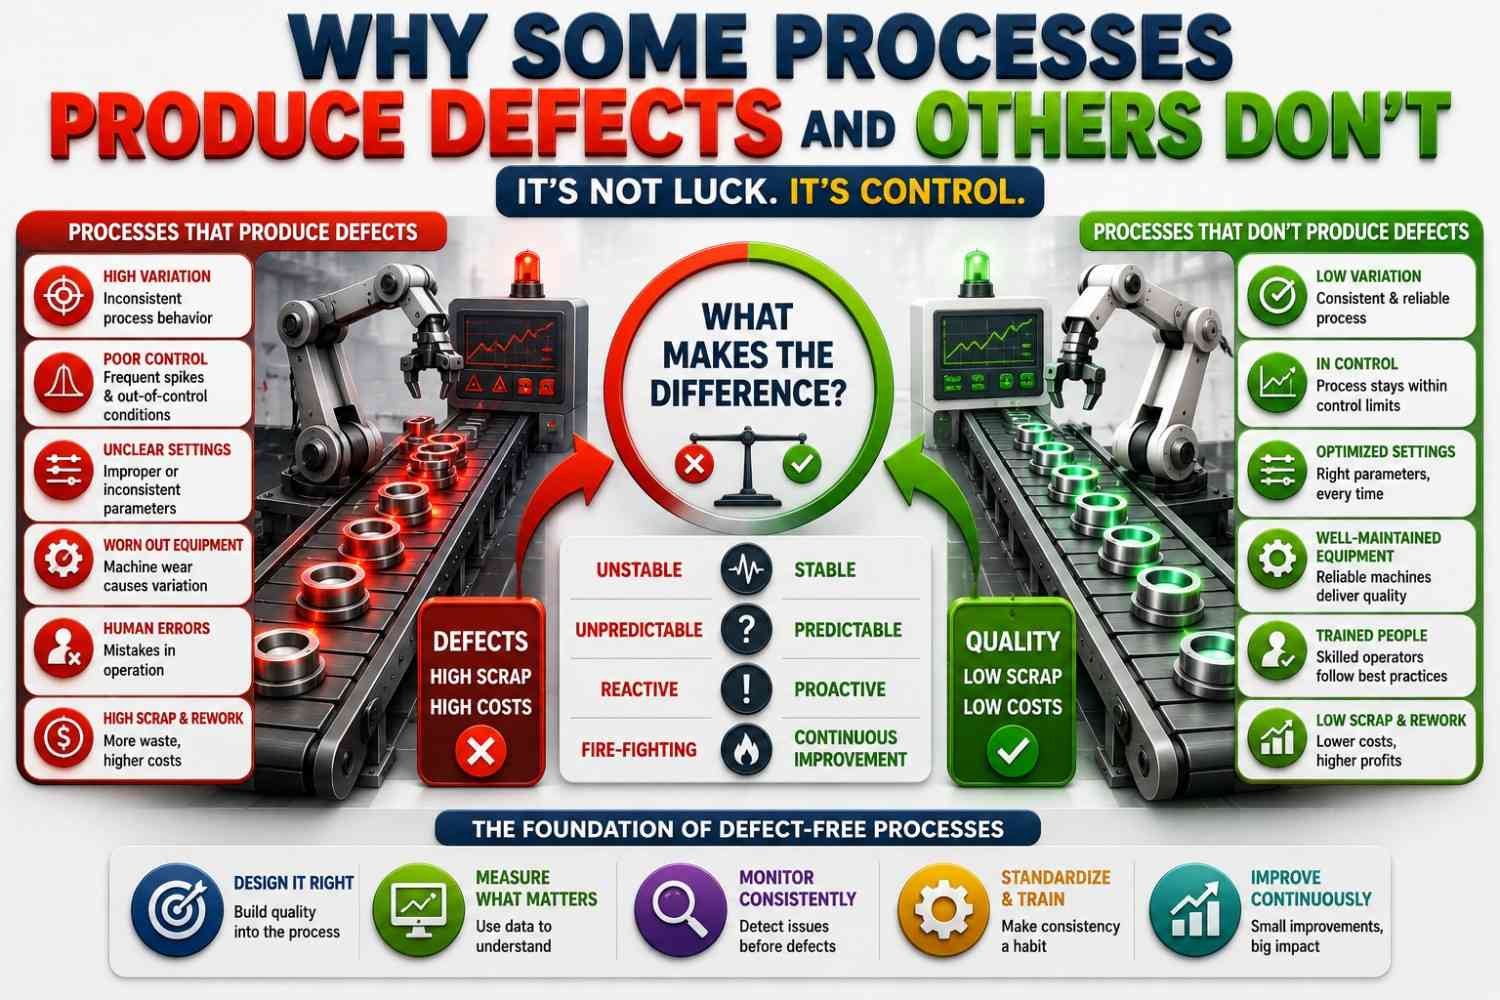
So, what changed? Most people immediately blame the machines, the operators, or the raw materials. While those factors certainly influence quality, they are rarely the real reason one process consistently outperforms another. In my experience working with manufacturing processes, the biggest difference usually comes down to how well the process variation is understood, monitored, and controlled.
The reality is that no manufacturing process is perfectly consistent. When process variation is not controlled, the consequences can be significant. Increased scrap, rework, customer complaints, delayed deliveries, warranty costs, and lost customer confidence all trace back to processes that can no longer consistently meet specifications.
Every production process experiences natural variation. Cutting tools gradually wear, machine temperatures change throughout the day, raw material properties vary between batches, fixtures experience small amounts of wear, and even slight adjustments made during machine setup can influence the final dimensions of a product.
Individually, these changes may seem insignificant. Collectively, however, they determine whether a process consistently produces parts that satisfy customer requirements—or gradually begins drifting toward defects.
One observation I’ve made over the years is that quality problems rarely begin with defective products. They usually begin with a process that is becoming less predictable. By the time inspection starts rejecting parts, the underlying process has often been changing for hours—or even days. That’s why relying only on final inspection is a reactive strategy. It tells you what has already happened, but it doesn’t tell you what is likely to happen next.
The important point is that the defects didn’t appear suddenly. The process had been sending warning signs long before the first defective part was produced. High-performing manufacturers approach quality differently.
Instead of asking,
“How many defective parts did we produce today?”
they ask “Based on how our process is performing today, how likely is it to produce defects tomorrow?”
That single question changes the entire approach to quality management. Instead of waiting for defects to appear, engineers focus on understanding whether the process itself is capable of consistently meeting customer specifications. If the process begins drifting toward the specification limits, corrective actions can be taken before nonconforming products reach the customer. This proactive way of thinking is one of the key principles behind Six Sigma and Statistical Process Control (SPC).
And this is exactly where Process Capability becomes such a powerful engineering tool. Rather than measuring yesterday’s quality results alone, Process Capability evaluates whether a process is capable of delivering consistent, predictable performance in the future. It helps engineers understand not only how much variation exists within a process, but also whether that variation is small enough to consistently satisfy customer requirements.
What is Process Capability?
Imagine you’re responsible for approving a manufacturing process before production begins. The process has produced 100 parts, and every one of them passed inspection. Does that automatically mean the process is capable?
Not necessarily.
Passing inspection today doesn’t guarantee the process will continue producing acceptable parts tomorrow. A process may appear to perform well for a short period while gradually drifting toward the specification limits. By the time the first defective part is detected, the process may have been changing for hours—or even days. This is exactly why quality engineers use Process Capability.
Rather than asking whether today’s products passed inspection, Process Capability asks a much more important question:
“Is this process capable of consistently meeting customer specifications over time?”
That small difference changes the entire approach to quality. Instead of focusing only on finished products, Process Capability focuses on the process that creates those products. The goal isn’t simply to detect defects after they occur—it’s to understand whether the process is predictable enough to prevent them from occurring in the first place.
A Simple Definition
Process Capability is a statistical measure of how well a stable process can consistently produce output within the customer’s specification limits.
In simple terms, Process Capability compares:
- The natural variation of the process, and
- The specification limits defined by the customer or design requirements.
If the process variation comfortably fits within those specification limits, the process is considered capable. If the process variation is wider than the allowable tolerance, the likelihood of producing defects increases. That’s why Process Capability isn’t really about measuring products—it’s about measuring the ability of the process to produce good products consistently.
Think About Archery for a Moment
One of the easiest ways to understand Process Capability is to imagine an archer shooting arrows at a target. If every arrow lands in a different location, the shots are unpredictable. If every arrow lands close together but far from the bullseye, the archer is consistent—but aiming at the wrong place. The ideal outcome is a tight group of arrows centered on the target. Manufacturing processes behave in much the same way. Every product coming off the production line is like another arrow. The customer’s specification limits define the acceptable target.
Process Capability tells us whether the overall pattern of results fits comfortably inside those limits—not whether one individual part happened to pass inspection. This is why experienced engineers spend far more time improving the process than sorting defective products.
One lesson I’ve learned while working with manufacturing processes is that a batch with zero defects doesn’t always indicate a capable process. I’ve seen production runs where every inspected part met specification, yet the capability study told a different story. The process average had already started drifting toward one specification limit. Nothing looked wrong at that moment, but the data showed there was very little safety margin remaining. Without that capability analysis, the next production run could easily have produced nonconforming parts.
Experiences like these reinforced an important lesson for me:
Inspection tells you the quality of today’s products. Process Capability tells you the health of tomorrow’s process.
That’s why experienced quality engineers rarely rely on inspection results alone. They want evidence that the process itself is stable, predictable, and capable of consistently meeting customer requirements.
🎓 Top-Rated Courses & Certifications
Try changing your filters or searching for another course.
Why World-Class Companies Measure Process Capability ?
World-class companies do not measure Process Capability just because it is a quality requirement or because a customer asked for Cp and Cpk values. If you’ve ever spent time in a manufacturing environment, you’ve probably heard someone say,
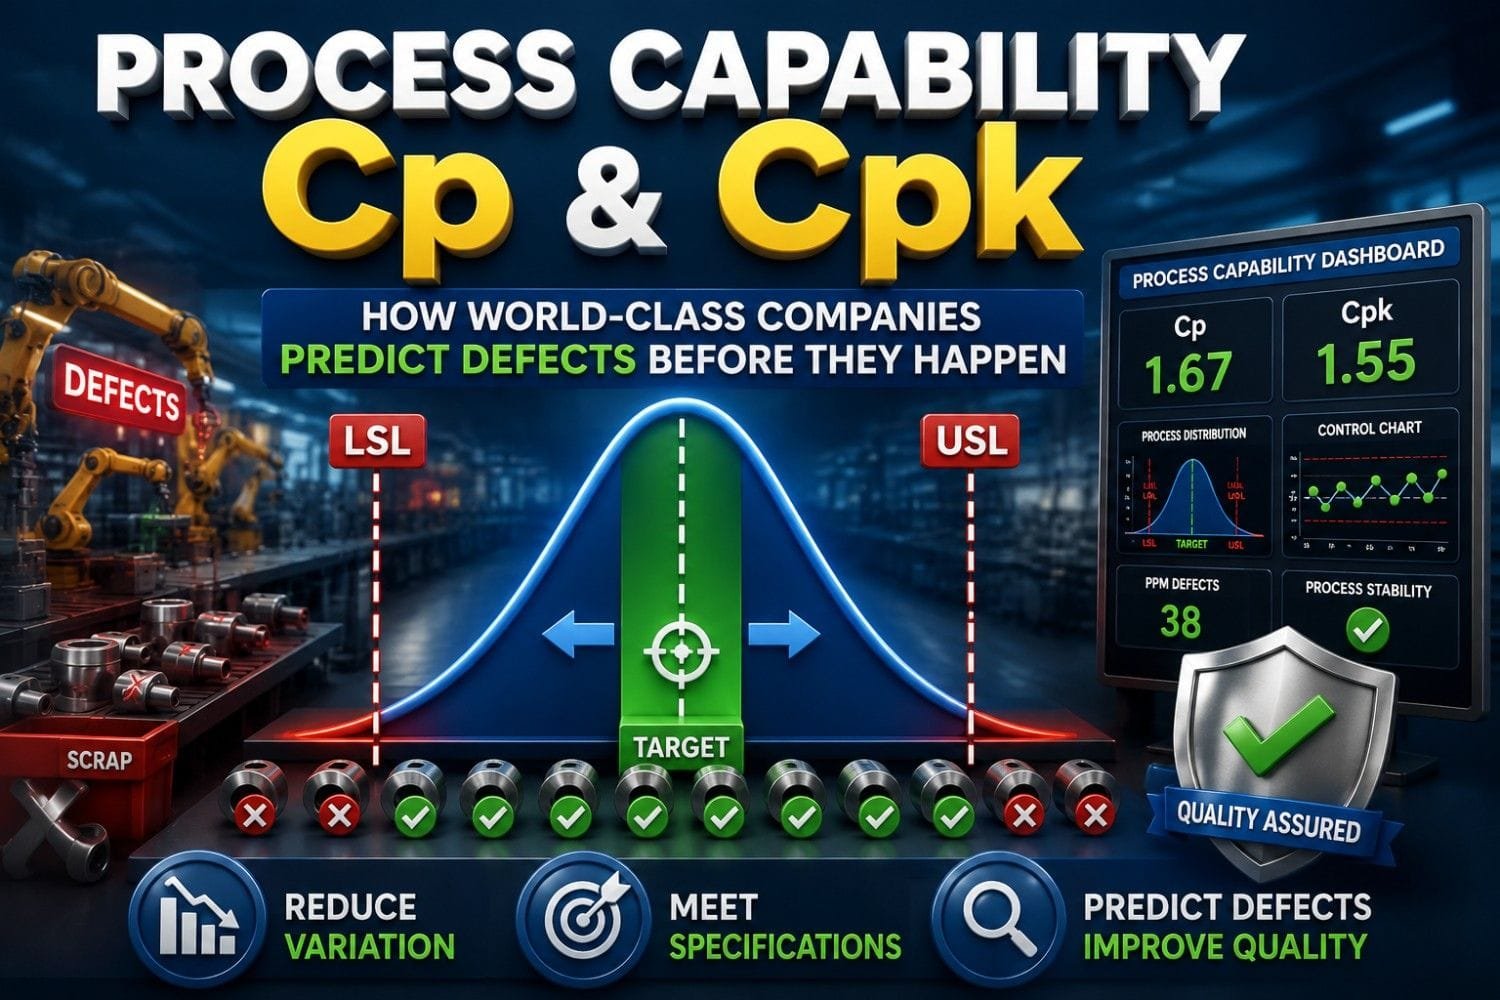
“Don’t worry—inspection will catch it.” At first, that sounds reassuring. After all, if every finished product is inspected, defective parts shouldn’t reach the customer… right?
Unfortunately, manufacturing doesn’t always work that way. By the time inspection identifies a problem, the process may have already produced hundreds—or even thousands—of parts. Some may need rework, others may be scrapped, and in the worst-case scenario, nonconforming products may have already moved further down the supply chain. This is one of the biggest reasons leading manufacturers don’t rely on inspection alone. They understand that quality shouldn’t be created at the inspection table—it should be built into the process itself.
That’s exactly where Process Capability becomes valuable.
Rather than asking : “Did today’s production pass inspection?” they ask a much more meaningful question:
“Based on how the process is performing today, how confident are we that it will continue meeting customer requirements tomorrow?”
It’s a subtle difference in wording, but it leads to a completely different approach to quality. One lesson I’ve learned while working with manufacturing teams is that a passing inspection report doesn’t always mean the process is healthy. I’ve seen production runs where every sampled part met specification, yet the capability analysis revealed that the process average was steadily drifting toward one of the specification limits. Nothing looked wrong at the time. There were no customer complaints. No rejected lots. No urgent production meetings. But the data was telling a different story.
Today, whenever I review process data, my first question isn’t: “Did everything pass?” Instead, it’s: “Is the process becoming more predictable or less predictable?” That question usually provides far more useful information than a simple pass-or-fail result.
Why Prevention is Always Better Than Inspection
A simple way to think about it is to compare a family doctor with an emergency room. A doctor focuses on keeping people healthy and identifying potential problems before they become serious. An emergency room, on the other hand, deals with issues after they have already occurred. Manufacturing quality works in much the same way.Inspection plays an important role because it helps identify nonconforming products before they reach the customer. However, inspection is primarily a detection activity. It tells us what has already happened. By the time a part fails inspection, the process may have been drifting, becoming unstable, or generating variation for hours, days, or even weeks.
Process Capability approaches quality from a completely different perspective.Instead of asking whether today’s products passed inspection, it asks whether the process itself is capable of consistently meeting customer requirements tomorrow. It helps engineers understand how much variation exists within a process, whether the process is operating safely within specification limits, and whether there are early signs that defects may eventually occur.
This predictive capability is one of the reasons world-class manufacturers rely so heavily on capability analysis. Rather than spending their time sorting defective parts, reworking products, or investigating customer complaints, they focus on understanding process behavior and reducing variation before quality problems emerge.
Their goal is not simply to catch bad parts. Their goal is to create processes that are so stable, predictable, and capable that bad parts are far less likely to be produced in the first place. In other words, inspection tells you what went wrong. Process Capability helps you understand what could go wrong—and gives you an opportunity to prevent it before it happens.
The Hidden Cost of Poor Process Capability
When engineers first learn about Process Capability, the conversation usually revolves around Cp, Cpk, formulas, and statistical calculations. Those metrics are certainly important, but they are only part of the story. In real manufacturing environments, poor Process Capability is rarely just a quality issue—it quickly becomes an operational and business issue. Every process that operates too close to its specification limits carries an element of risk, even if today’s production appears to be perfectly acceptable.
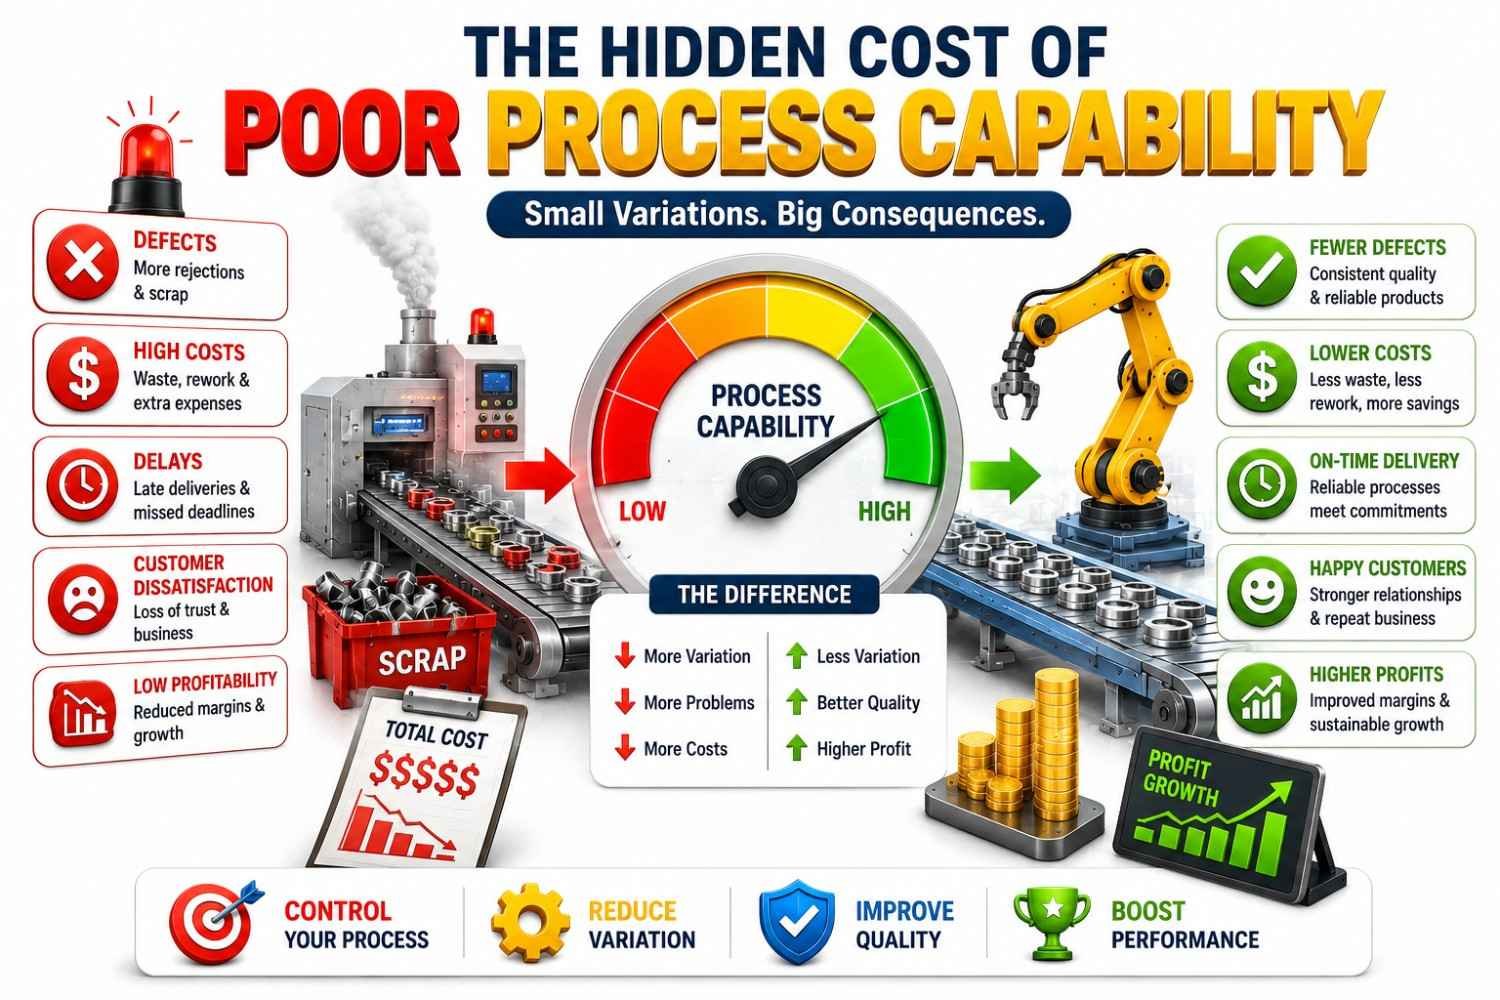
One of the biggest misconceptions I’ve come across is the belief that a process is healthy simply because the latest inspection report shows no defects. Over the years, I’ve learned that the first defective part is often the last warning, not the first one. Long before a product falls outside the specification limits, the process usually starts sending subtle signals. The average may slowly drift away from the target, process variation may increase, or operators may find themselves making more frequent machine adjustments just to keep production within tolerance. None of these changes seem alarming on their own, but together they gradually reduce the process’s ability to produce consistent results.
What makes poor Process Capability particularly dangerous is that its costs are rarely visible at the beginning. They accumulate quietly. A few extra machine adjustments each shift don’t seem significant. Spending a little more time inspecting parts doesn’t raise immediate concern. Reworking a handful of components may even be accepted as “part of the process.” However, over weeks and months, these small inefficiencies begin to compound. Production slows down, scrap increases, engineering resources become tied up investigating recurring issues, and manufacturing teams spend more time reacting to problems than improving the process.
Early in my career, I assumed that producing an entire batch without defects meant the process was performing exceptionally well. Then an experienced engineer asked me a question that completely changed my perspective:
“Are you confident the process is truly capable, or are you simply pleased that today’s parts happened to pass inspection?”
At the time, I didn’t fully appreciate the difference. Looking back, it was one of the most valuable lessons I learned. A capable process isn’t defined by one successful production run. It’s defined by its ability to deliver consistent results day after day, despite normal variations such as tool wear, material differences, temperature changes, or routine equipment adjustments.
Another observation I’ve made while working with manufacturing teams is that poorly capable processes often create what quality professionals informally call a “hidden factory.” The official production line continues manufacturing parts, but an invisible second operation quietly develops alongside it. Operators spend extra time making adjustments. Inspectors perform additional checks. Engineers investigate recurring issues. Technicians recalibrate equipment. Production planners reschedule work to recover lost time. None of these activities add value for the customer, yet they consume a surprising amount of time, effort, and money.
The unfortunate reality is that most of these costs never appear as a single line item in a financial report. Instead, they’re spread across scrap, rework, overtime, delayed shipments, additional inspections, engineering investigations, and reduced production efficiency. Individually, each cost may seem manageable. Collectively, they can have a significant impact on profitability.
This is why experienced manufacturing teams pay close attention to Process Capability. A declining Cpk value is often treated as an early warning rather than just another statistical result. It gives engineers an opportunity to investigate the process while production is still under control. In many cases, the corrective action is relatively straightforward—replacing a worn cutting tool, re-centering the process, verifying machine calibration, improving fixture alignment, reviewing raw material consistency, or confirming that the measurement system is performing as expected.
Those are relatively small actions.
Now compare that with discovering the same issue after several thousand parts have already been produced.
The conversation changes immediately. Instead of discussing process improvement, the team is deciding which batches are affected, whether products must be quarantined, how much rework is required, whether shipments need to be delayed, and what corrective actions should be communicated to the customer. At that stage, the organization is no longer preventing problems—it is managing the consequences of problems that could have been avoided.
That’s the real value of Process Capability. It doesn’t simply help engineers calculate statistical indices; it helps organizations identify risk before that risk becomes expensive. In my experience, the best manufacturing teams don’t wait for defects to tell them something is wrong. They use process data to recognize early warning signs, make timely adjustments, and keep the process stable long before customers ever notice a problem.
Key Takeaway: Poor Process Capability is expensive not because it produces a few defective parts, but because it quietly creates waste throughout the entire manufacturing system. Organizations that consistently deliver high-quality products understand that preventing process variation is almost always less costly than correcting its consequences later.
Before Calculating Cp and Cpk: Is Your Process Stable Enough?
One of the most common mistakes I see when engineers begin learning Process Capability is assuming that the moment measurement data is available, it’s time to calculate Cp and Cpk. At first, that seems perfectly logical. After all, if you’ve collected enough measurements, why not calculate the capability indices and find out whether the process is capable? The problem is that Cp and Cpk only produce meaningful results when the process is statistically stable. Imagine you’ve just completed a capability study and proudly present a Cpk of 1.45 during a quality review meeting. The numbers look impressive, and everyone seems pleased.
Then someone asks a simple question: “Was the process statistically stable while you collected the data?”
If the answer is “I’m not sure,” the discussion changes immediately
Suddenly, those capability numbers lose much of their value—not because the calculations were incorrect, but because the data itself may not represent the true behavior of the process. One lesson I’ve learned over the years is that good calculations cannot compensate for poor data. If the process keeps changing while you’re collecting measurements, Cp and Cpk are no longer describing one process. They’re averaging several different process conditions together, and that can lead to conclusions that are both inaccurate and expensive. That’s why I never begin a capability study by opening Excel or statistical software. I begin by asking a much simpler question: “Can I trust this process to behave consistently?”
We also need to understand process stability also. Every manufacturing process contains variation. In fact, if you measure the same characteristic hundreds of times, no two values will be exactly identical. That doesn’t necessarily mean something is wrong. Some variation is simply part of normal manufacturing. Small differences in raw material properties, minor temperature changes, machine vibration, measurement resolution, or routine process fluctuations are expected. These are known as common causes of variation, and they exist even in well-controlled manufacturing processes.
The situation changes when something unexpected influences the process. A worn cutting tool, an incorrect machine setup, a faulty sensor, inconsistent material, loose fixture, or operator error can suddenly change the way the process behaves. These are known as special causes of variation, and unlike common causes, they make the process unpredictable.
A statistically stable process is one where only common-cause variation is present. Once special causes begin affecting the process, yesterday’s data may no longer represent tomorrow’s performance. That’s exactly why stability is checked before capability.
Why Stability Matters More Than Most Engineers Realize
A useful way to think about this is to compare Process Capability with a weather forecast. If the weather has followed a consistent pattern for several weeks, predicting tomorrow’s temperature is relatively reliable. But imagine the weather changes dramatically every few hours. Under those conditions, yesterday’s pattern tells you very little about tomorrow. Manufacturing processes work the same way. Cp and Cpk are based on the assumption that the variation you’re measuring reflects the normal behavior of the process. If the process keeps changing because of machine adjustments, tool wear, material differences, or other special causes, that assumption no longer holds true. In other words, you’re trying to predict the future using data from a process that isn’t behaving consistently. That’s why experienced quality engineers don’t ask, “What’s the Cpk?” as their first question.
They ask : “Is the process stable enough for the Cpk to mean anything?”
The most effective way to evaluate process stability is by using a Control Chart, one of the fundamental tools of Statistical Process Control (SPC). Unlike specification limits, which define what the customer considers acceptable, a Control Chart shows how the process behaves over time. Instead of asking,
“Did this part pass inspection?”
a Control Chart asks, “Is the process behaving consistently, or has something changed?” A stable process generally shows random variation within its control limits while an unstable process often leaves clues that something unusual is happening.
📚 Recommended Books for Professionals
Try removing one or more filters.
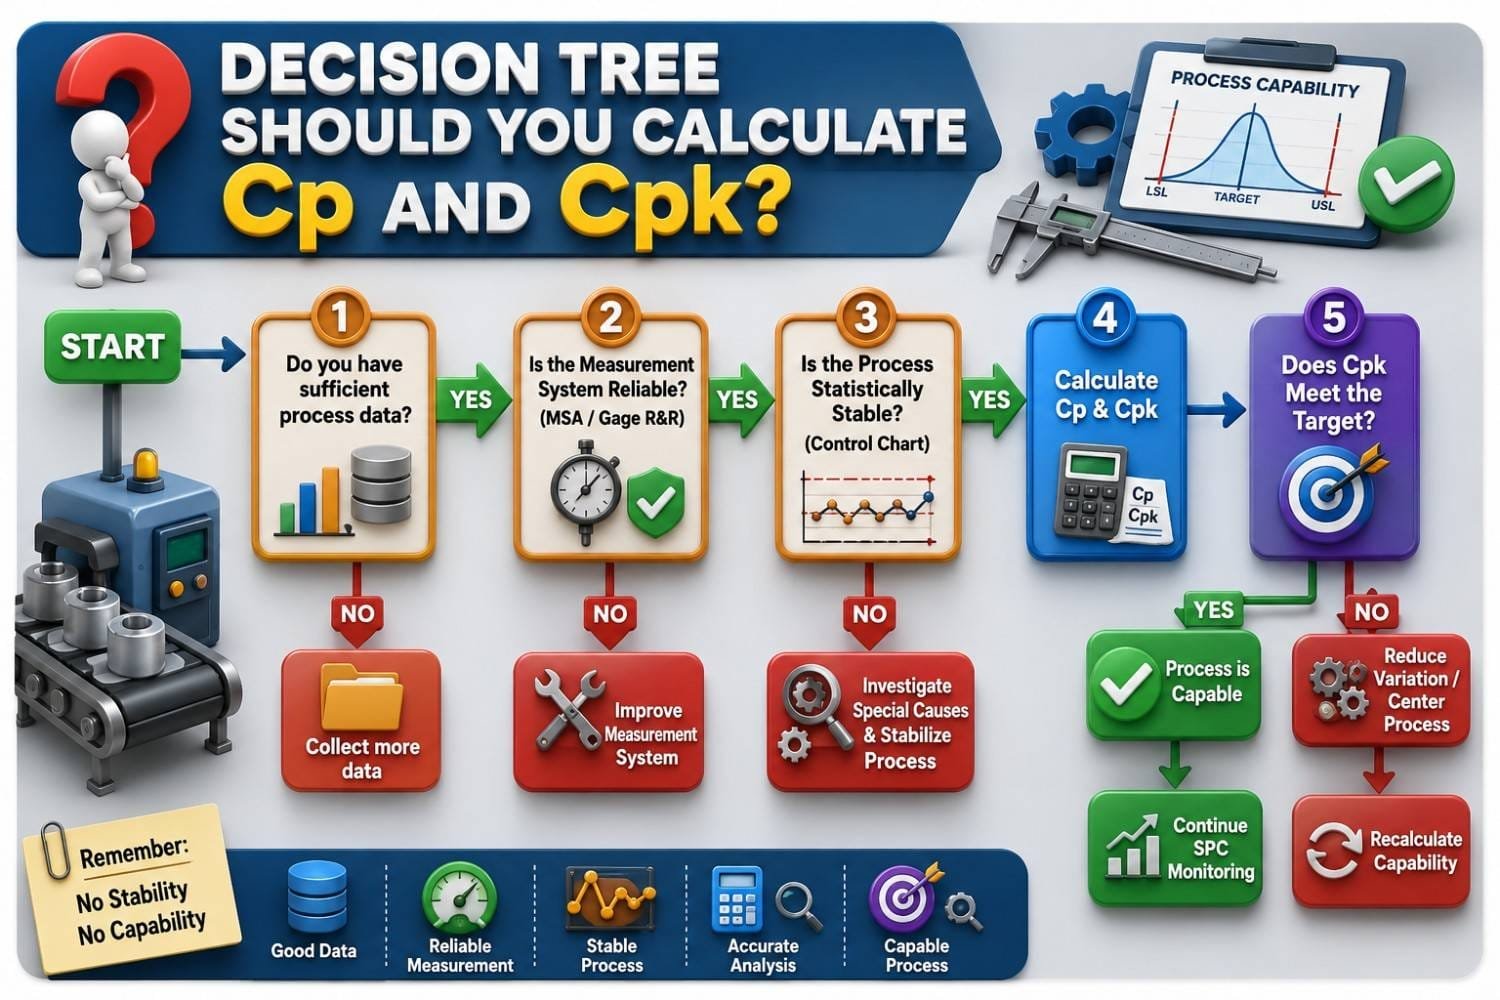
Decision Tree: Should You Calculate Cp and Cpk?
One lesson I've learned over the years is that capability calculations are only as good as the process data behind them. Before calculating Cp and Cpk, it is worth taking a few minutes to confirm that the measurement system is reliable, the process is stable, and the data truly represents normal operating conditions.
The following decision tree provides a practical checklist that quality engineers can use before starting a capability study.
Understanding Cp: The Potential Capability of a Process
Now that we've established why process stability matters, let's talk about the first capability metric most quality professionals encounter: This is where Cp, also known as the Process Capability Index, comes into the picture. At first glance, Cp looks like just another statistical calculation. But in practice, it's answering a very important question: If the process were perfectly centered, would it have enough room to consistently meet customer specifications?
Cp (Process capability index) is the index that measures the potential capability of the process. It compares the width of the specification range to the natural spread of the process, usually represented by six standard deviations.
The formula for Calculating Cp is =
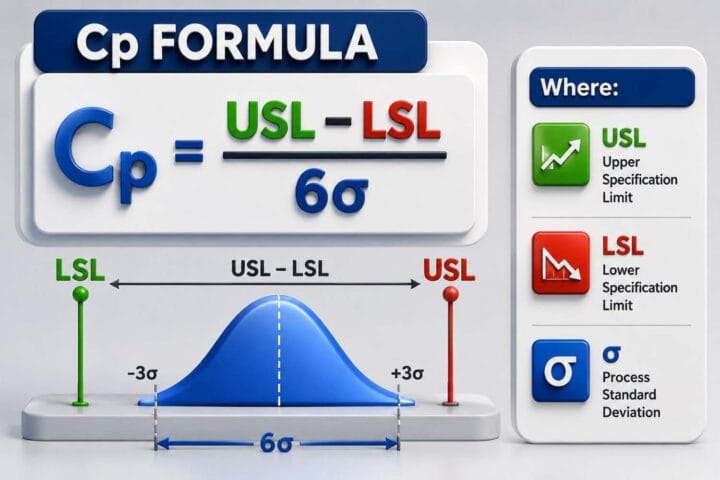
One mistake I frequently see is that people assume a high Cp value automatically means the process is performing well. It sounds reasonable, but that's not always true. In reality, Cp doesn't tell you how your process is performing today—it tells you how well your process could perform if it were perfectly centered between the specification limits.
That's why Cp is often called the Potential Process Capability. It compares the width of the customer specification range with the natural spread of the process. The more room available between process variation and specification limits, the higher the Cp value.
Interpretation of Cp
If Cp is high, the process variation is narrow relative to the specification range. That means the process could perform well if it is centered. If Cp is less than 1.00, the process spread is wider than the specification width, which means defects are likely even if the process is centered. If Cp is around 1.33, the process is generally considered capable in many industries. Values above 1.67 indicate a very capable or high-performing process.
Understanding Cpk: The Actual Capability of a Process
In the previous section, we learned that Cp measures the potential capability of a process. It tells us whether the natural variation of a stable process is small enough to fit comfortably within the customer's specification limits. If Cp tells us what a process could achieve under ideal conditions, then Cpk tells us what the process is actually achieving in the real world. And in my experience, this is why Cpk is often the capability metric that quality engineers pay the most attention to.
Over the years, I've reviewed many capability studies where the Cp value looked impressive. The process variation was small, the numbers appeared strong, and everyone felt confident about the results. But when we looked at the actual production data, a different story emerged. The process wasn't centered on the target. It had gradually shifted toward one specification limit, leaving very little safety margin on one side. That's where Cpk becomes important.
Cpk (Process capability performance index) goes one step further. It measures actual capability by checking not only spread, but also where the process mean sits inside the specification range.
The formula for Calculating Cpk is =
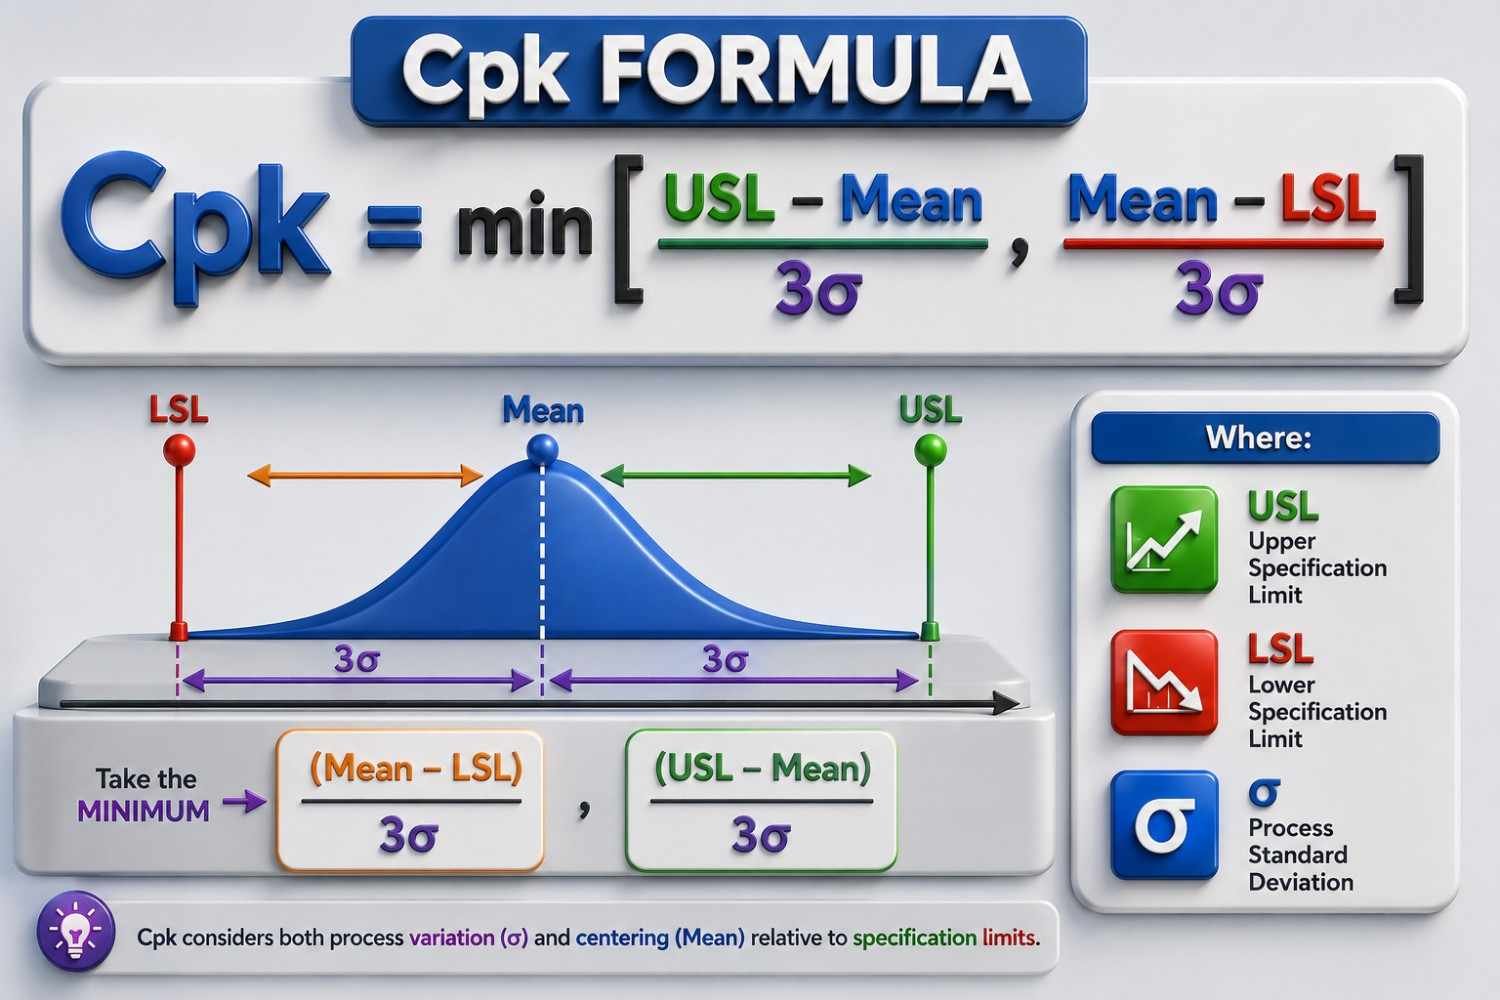
Where:
- USL = Upper Specification Limit
- LSL = Lower Specification Limit
- X̄ = Process Mean
- σ = Process Standard Deviation
Instead of asking, "How capable could this process be if everything were perfectly centered?", Cpk asks a more practical question: This is why Cpk is known as the Actual Process Capability Index. It measures capability while taking both process variation and process centering into account.
Interpretation of Cpk
I've seen that while reviewing capability studies is that a high Cp value often gets everyone's attention, but Cpk usually tells the real story.
Cp vs Cpk : What's the Difference?
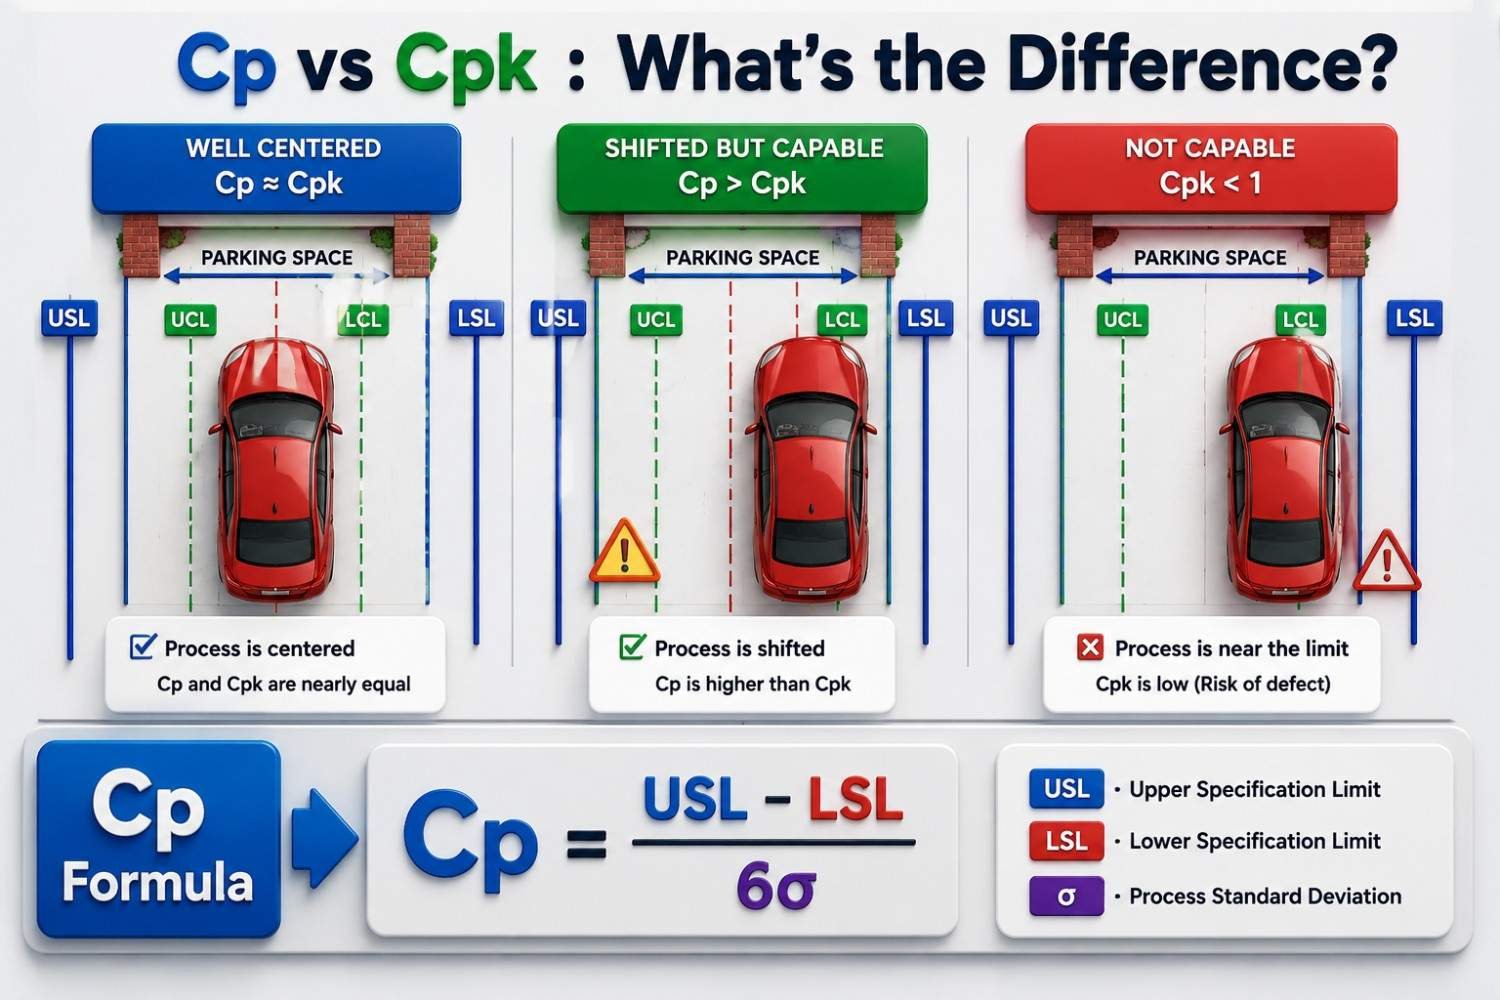
At first glance, Cp and Cpk appear to measure the same thing. Both evaluate whether a manufacturing process can consistently meet customer specifications. However, they answer two very different questions. The easiest way to understand the difference is to think of your manufacturing process as parking a car in a parking space, as illustrated in the figure above.
In this analogy:
- The parking space represents the customer's specification limits (USL and LSL).
- The car represents the natural variation of your manufacturing process.
- The position of the car represents the process average (mean).
Scenario 1 : The Process Is Well Centered (Cp ≈ Cpk)
Look at the first image. Here, the car is parked almost perfectly in the center of the parking space. There is plenty of room on both sides, giving the driver a comfortable safety margin. This is exactly what engineers hope to see in a manufacturing process. The process variation is small, and the process average is centered between the specification limits. Because the process is balanced, Cp and Cpk are nearly equal.
In practical terms, this means the process is not only capable of meeting customer requirements but is also making full use of its available capability. Whenever I review capability studies and see Cp and Cpk with nearly identical values, it's usually a good indication that the process is stable, centered, and well controlled.
Scenario 2 : The Process Has Shifted (Cp > Cpk)
Now look at the middle image. Notice something important. The parking space hasn't become any smaller. The car hasn't become any wider. The only thing that has changed is the position of the car. It has drifted toward one side. This is one of the most common situations encountered in manufacturing. The natural variation of the process hasn't increased significantly, so Cp remains relatively high. However, because the process average has shifted closer to one specification limit, the available safety margin has decreased. As a result, Cpk becomes lower than Cp. This tells us something extremely valuable. The process has enough potential capability, but it isn't operating at its optimum position.
One lesson I've learned from reviewing manufacturing data is that this situation is often easier to improve than many engineers expect. In many cases, the solution isn't to reduce variation—it is simply to re-center the process. A small adjustment to machine offsets, tooling, fixtures, or setup parameters can move the process average back toward the target and significantly improve Cpk without changing the overall variation.
Scenario 3: The Process Is Too Close to the Specification Limit
Now look at the third image. The car is parked very close to one side of the parking space. There's almost no room left for error. Even a slight movement could cause the car to cross the boundary. Manufacturing processes behave exactly the same way. When the process average moves too close to either the Upper Specification Limit (USL) or the Lower Specification Limit (LSL), even normal process variation can push products outside customer requirements. This results in a low Cpk, indicating a higher risk of producing nonconforming parts.
Although the process may still be producing acceptable products today, it has very little safety margin left. Without corrective action, defects become increasingly likely as the process continues to drift. This is precisely why experienced quality engineers monitor Cpk regularly. It acts as an early warning indicator, allowing teams to make adjustments before customers are affected.
Can a Process Be in Control but Not Capable?
One question almost every engineer asks when learning Statistical Process Control (SPC) is: "If my process is stable and under statistical control, doesn't that automatically mean it's capable?"
At first, the answer seems obvious. If the process behaves consistently every day, shouldn't it also produce good parts every day?
Not necessarily
This is one of the most important concepts in quality engineering, and it's also one of the easiest to misunderstand. A process that is in statistical control simply means it behaves predictably. The variation you see today is similar to the variation you'll probably see tomorrow because no unusual or special causes are influencing the process. A Control Chart helps answer one question: "Is the process behaving consistently over time?"
Process Capability, however, answers a completely different question: "Can this stable process consistently meet the customer's specification limits?"
Although these questions are closely related, they are not interchangeable. Think of it this way. A process can be extremely predictable and still produce parts that don't meet customer requirements. Stability tells us how consistently the process behaves; capability tells us whether that consistent performance is actually good enough.
I learned this lesson during one of my early capability reviews. The production team was pleased because the Control Chart looked almost perfect. There were no points outside the control limits, no unusual trends, and very few process adjustments throughout the production run. Everything suggested the process was well controlled.
Then we compared the same data with the customer's specification limits. That's when the real picture emerged. The process average had gradually shifted toward one side of the tolerance band. The variation itself wasn't excessive, but because the process was no longer centered, the safety margin had become much smaller. The process was stable, yet it was steadily moving closer to producing nonconforming parts.
That experience completely changed how I evaluate manufacturing data. Since then, I've never assumed that a stable Control Chart automatically means a healthy process. The first confirms that the process is predictable; the second confirms whether that predictable process is capable of meeting customer expectations.
A simple analogy makes the difference easier to understand. Imagine a professional archer who shoots ten arrows. Every arrow lands tightly grouped together, demonstrating excellent consistency. But if that entire group lands several inches to the left of the bullseye, would you say the target was successfully hit?
Probably not. The archer is consistent, but not accurate.
Manufacturing processes behave in exactly the same way. A stable process may produce highly consistent results, but if those results are consistently drifting toward—or beyond—the specification limits, customer requirements are still not being met.
This is why quality engineers evaluate both process control and process capability. Statistical control provides confidence that the process is predictable. Capability analysis then determines whether that predictable process has enough room to consistently produce products within specification.
The most reliable manufacturing processes achieve both. They are stable enough to be predictable and capable enough to satisfy customer requirements with a comfortable safety margin. That combination is what allows world-class manufacturers to prevent defects instead of simply detecting them after production.
Real Manufacturing Example: Calculating Cp and Cpk Step-by-Step
By now, we've discussed what Process Capability is, why process stability matters, and how Cp and Cpk help us understand whether a manufacturing process can consistently meet customer requirements. But understanding the concepts is only half the story. The next question most engineers ask is: "How do I actually calculate Cp and Cpk using real production data?"
This is where many articles immediately present formulas and statistical equations. While the mathematics is important, I've found that people learn much faster when they first understand the problem the numbers are trying to solve. Let's walk through a realistic manufacturing example that closely reflects the type of capability study quality engineers perform during routine production.
Imagine a CNC machining process producing a precision steel shaft used in an industrial assembly. According to the engineering drawing, the shaft diameter must be:
Target Dimension = 20.00 mm
The customer allows a tolerance of ±0.10 mm, giving us:
- Lower Specification Limit (LSL) = 19.90 mm
- Upper Specification Limit (USL) = 20.10 mm
After confirming that the process is statistically stable using a Control Chart, the quality engineer collects measurements from 30 consecutive parts. The analysis produces the following results:
At first glance, everything appears to be under control. Most of the measured parts fall comfortably within the specification limits, and there are no obvious signs of excessive variation. But experienced engineers rarely stop there. Instead of asking : "Did today's parts pass inspection?"
they ask a more valuable question: "Based on this process variation, how likely is it that future production will continue meeting specification?"
That's exactly what Cp and Cpk help answer.
Step 1: Calculate Cp
The first capability index to calculate is Cp, which measures the potential capability of a stable process.
The formula is: Cp = (USL − LSL) / (6σ)
Substituting the values: Cp = (20.10 − 19.90) ÷ (6 × 0.025)
Cp = 0.20 ÷ 0.15
Cp = 1.33
What Does This Mean? A Cp value of 1.33 tells us that the natural variation of the process is comfortably smaller than the customer's tolerance. In simple terms, the process appears to have enough capability to consistently manufacture acceptable parts.
If the process were perfectly centered, it should be capable of meeting specification with a comfortable safety margin. But there's still an important question left unanswered.
Is the process actually centered?
To answer that, we calculate Cpk.
Step 2: Calculate Cpk
Unlike Cp, Cpk considers where the process average is located.
Instead of assuming the process is perfectly centered, Cpk measures the distance between the process average and the nearest specification limit.
The formula is: Cpk = Minimum [(USL − Mean) / 3σ , (Mean − LSL) / 3σ]
Using our production data:
Upper Side = (20.10 − 20.03) ÷ (3 × 0.025)
= 0.07 ÷ 0.075
= 0.93
Lower Side= (20.03 − 19.90) ÷ (3 × 0.025)
= 0.13 ÷ 0.075
= 1.73
The smaller value becomes Cpk.
Cpk = 0.93
Interpreting the Results This is where the capability study becomes interesting.
At first glance, Cp = 1.33 looks excellent. Many engineers might stop there and conclude that the process is capable. But Cpk tells a different story.
Although the process variation is relatively small, the process average has shifted toward the Upper Specification Limit. That shift has reduced the available safety margin. Today's production may still satisfy customer requirements, but the process is operating much closer to the upper tolerance than intended. In other words, the process has the potential to perform well, but it isn't currently operating at its full capability.
My perspective: Whenever I review a capability study like this, my first instinct isn't to focus on reducing process variation. The data already suggests that the process is performing with a good level of consistency. Instead, I look at where the process is operating within the specification limits. In this example, the greater opportunity lies in re-centering the process rather than making it less variable.
In many manufacturing environments, achieving that improvement doesn't require a major process redesign. Something as simple as correcting a machine offset, replacing a worn cutting tool, or fine-tuning a setup parameter can shift the process average back toward the target. What's interesting is that the process variation may remain virtually unchanged, yet the Cpk can improve significantly because the process has regained a larger safety margin from both the upper and lower specification limits.
This is a lesson I've learned repeatedly over the years. Many engineers naturally assume that improving Process Capability always means reducing variation. While reducing variation is certainly important in some situations, it's not always the first or the most effective solution. If the process is already stable and consistent, simply bringing it back to the target can often deliver a faster and more meaningful improvement.
That's one of the reasons experienced quality engineers rarely rely on a single capability index. They interpret Cp and Cpk together because each tells a different part of the story. Cp indicates whether the process has the potential to meet customer requirements by comparing its natural variation with the available specification tolerance. Cpk builds on that by showing whether the process is actually achieving that potential, taking into account where the process average is positioned within those specification limits. Looking at both indices together provides a far more complete picture of process performance and helps teams focus their improvement efforts where they will have the greatest impact.

Lean Six Sigma • Six Sigma • Statistics • Project Management • Artificial Intelligence (AI) • Operations Management • Quality Management
Process Capability vs Process Performance (Cp/Cpk vs Pp/Ppk)
As you begin working with Process Capability, you'll eventually come across another pair of indices that look almost identical to Cp and Cpk—Pp and Ppk. The first time I saw them in a capability report, I assumed they were simply different names for the same calculations. After all, the formulas looked nearly identical, and both seemed to measure process quality. It wasn't until I started reviewing capability studies from actual production lines that I realized they answer two very different questions.
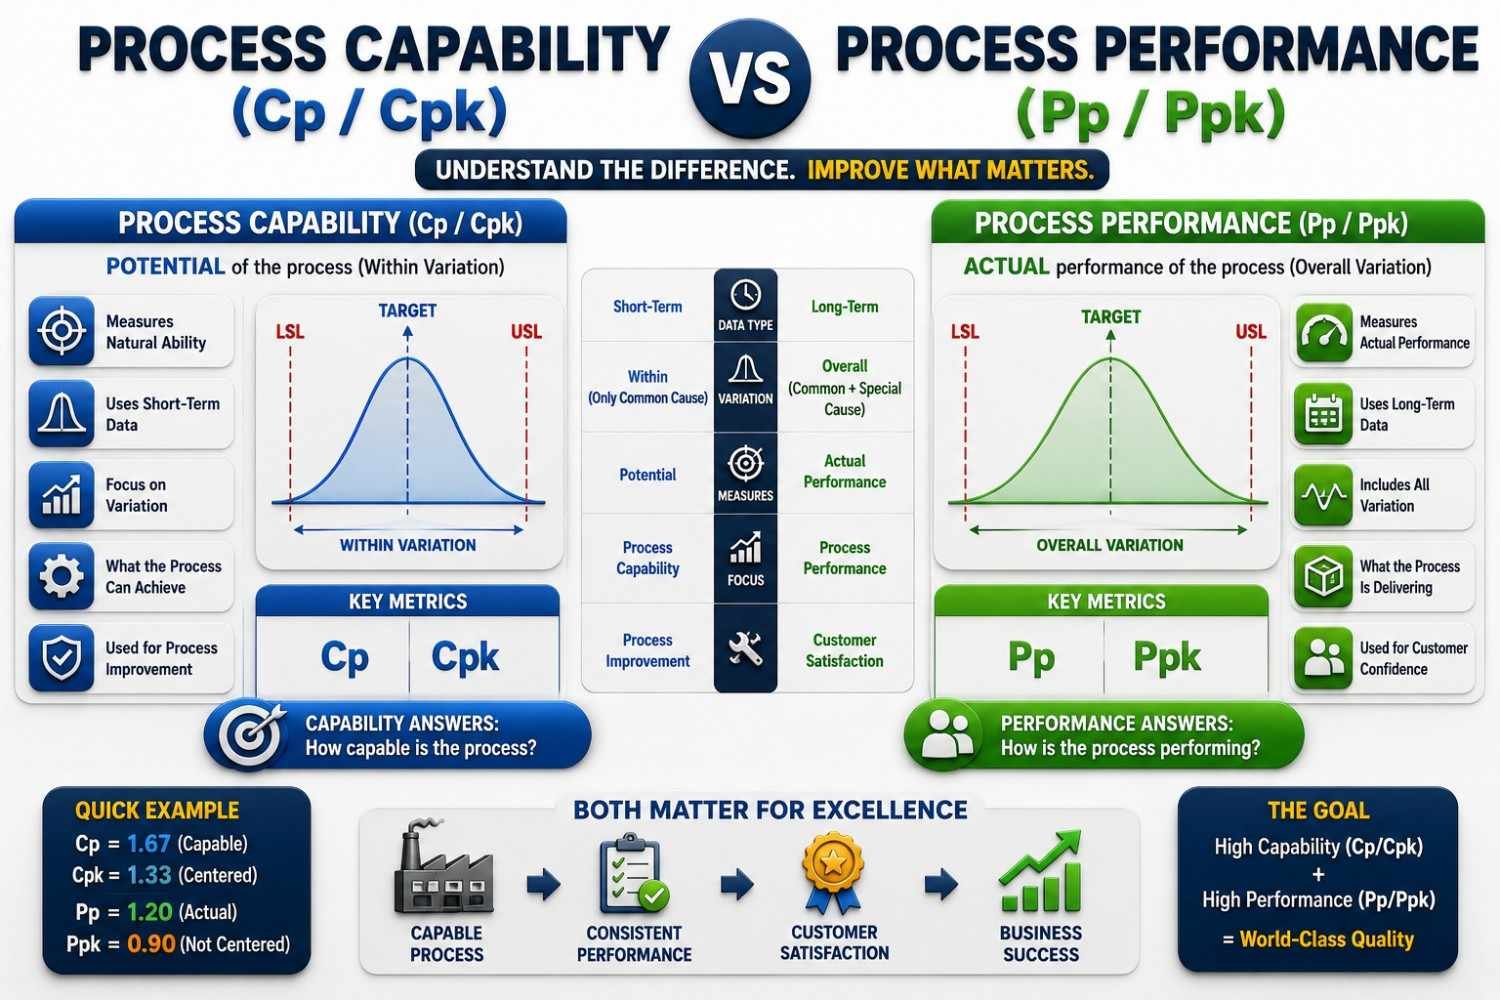
The easiest way to remember the difference is this:
Process Capability tells you what the process is capable of achieving under stable, controlled conditions.
Process Performance tells you what the process has actually delivered over time.
That may sound like a subtle distinction, but in manufacturing it can significantly change how you interpret process data and where you focus your improvement efforts.
Before calculating Cp and Cpk, we first verify that the process is statistically stable. Once that condition is met, these indices evaluate the inherent capability of the process by using short-term variation—the natural variation observed when the process is operating normally and special causes have been eliminated. In other words, Cp and Cpk estimate how well the process should perform when it is under control.
Pp and Ppk take a different perspective. Instead of looking only at short-term behavior, they evaluate long-term process performance using data collected over an extended production period. That data naturally includes the realities of day-to-day manufacturing: tool wear, operator changes, raw material differences, equipment maintenance, environmental conditions, and other sources of variation that occur during normal operations. Rather than asking what the process can achieve, Pp and Ppk reveal what it has actually achieved.
One way I like to explain this is by thinking about a professional athlete. During training, the athlete performs under controlled conditions, following a planned routine with consistent equipment and minimal distractions. Those results reflect the athlete's potential. But performance during an entire competitive season is different. Weather changes, travel schedules, fatigue, injuries, and varying levels of competition all influence the outcome. Manufacturing processes are no different. Cp and Cpk represent the process at its best under controlled conditions, while Pp and Ppk reflect how that same process performs in the real world over time.
I've also noticed that many engineers become concerned when they see a capability report where Cpk is higher than Ppk. Their first reaction is often that something must be wrong with the process. In many situations, that's not the case at all. A lower Ppk simply tells us that additional long-term variation exists in everyday production. Machines gradually wear, operators change between shifts, new material lots are introduced, and environmental conditions fluctuate. These are normal aspects of manufacturing, and they usually make long-term performance slightly different from the short-term capability observed during a controlled study.
When deciding which metrics to use, I always start by asking what question I'm trying to answer. If I'm validating a new process, qualifying equipment, or confirming the effectiveness of a process improvement, I rely primarily on Cp and Cpk because they measure the process's inherent capability once stability has been established. If I'm reviewing several months of production data to understand how consistently the process has performed in everyday manufacturing, I place greater emphasis on Pp and Ppk because they reflect long-term operational performance. Neither set of indices is more important than the other—they simply provide different perspectives on the same process.
How World-Class Companies Improve Process Capability
One of the biggest misconceptions I see when engineers first begin working with Process Capability is that improving Cp or Cpk becomes the objective. Teams start discussing target values such as 1.33, 1.67, or even 2.00, believing that if those numbers increase, the process has automatically improved.
Over the years, I've learned that experienced quality engineers think about capability very differently. They understand that Cp and Cpk are outcomes—not objectives. The numbers simply reflect how well the process is performing. Trying to improve the capability index without improving the process itself is a bit like trying to lower your blood pressure by changing the reading on the monitor. The display may show a number, but the real work happens elsewhere.
Whenever I review a capability study that shows a low Cp or Cpk, my first question is rarely, "How can we increase the capability index?" Instead, I ask, "What is introducing unnecessary variation into this process?" That simple change in perspective often leads to far more productive discussions. Once the sources of variation are identified and controlled, capability usually improves as a natural consequence.
In my experience, processes rarely become more capable because someone decided they needed a higher Cpk. They improve because engineers took the time to understand how the process actually behaved. Sometimes the answer is obvious, such as replacing a worn cutting tool or correcting a machine offset. Other times it requires a deeper investigation into fixture alignment, raw material consistency, machine maintenance, measurement system performance, environmental conditions, or process settings. Every source of unnecessary variation that is removed gives the process a better chance of consistently meeting customer requirements.
Another observation I've made is that highly capable processes are never considered "finished." Even when capability studies show excellent results, experienced teams continue looking for opportunities to simplify the process, improve consistency, reduce variation, and make performance more predictable. Continuous improvement isn't driven by the belief that something is wrong—it's driven by the understanding that every process has room to become more robust.
Ultimately, that's what Process Capability is really about. It isn't about achieving the highest possible Cp or Cpk value to satisfy a report or a customer requirement. It's about creating a process that performs so consistently that producing quality products becomes the normal outcome rather than the exception. When engineers focus on understanding variation instead of chasing capability numbers, improvements become more meaningful, more sustainable, and far more valuable to both the business and the customer.
Frequently Asked Questions (FAQs)
What is Cp in simple terms?
Cp measures how much variation your process has compared to allowed limits.
What is Cpk in simple terms?
Cpk measures how well your process is centered within limits.
Which is more important Cp or Cpk?
Cpk, because it reflects real performance.
Can Cp be high and Cpk low?
Yes, when process is not centered.
What is ideal Cpk value?
Typically ≥ 1.33 in most industries.
Why Cp and Cpk are used?
To evaluate process performance and ensure quality.
Is Cpk more important than Cp?
Yes, because Cpk measures actual process capability by considering both process variation and how well the process is centered.
Can a stable process be incapable?
Yes, a process can be statistically stable yet consistently produce parts outside customer specification limits.
Why is 1.33 Cpk considered acceptable?
A Cpk of 1.33 provides a reasonable safety margin, meaning the process variation comfortably fits within specification limits for most industries.
What happens if Cp is greater than Cpk?
It indicates the process has sufficient potential capability but is not properly centered within the specification limits.
What happens if Cpk is greater than Cp?
No, Cpk can never be greater than Cp because actual capability cannot exceed the process's potential capability.
What is a good Cp value?
A Cp of 1.33 or higher is generally considered good, while 1.67 or above is preferred for critical manufacturing processes.
What is a good Cpk value?
A Cpk of 1.33 or higher is widely accepted, although industries such as medical devices and aerospace often target 1.67 or higher.
Free Process Capability Calculator
Understanding Cp and Cpk formulas is important, but seeing the numbers in action makes the concept much easier to grasp. Use the calculator below to instantly determine your process capability based on the process mean, standard deviation, and specification limits.
Simply enter:
- Process Mean
- Standard Deviation (σ)
- Lower Specification Limit (LSL)
- Upper Specification Limit (USL)
Then click Calculate to see your Cp, Cpk, and a simple interpretation of whether your process is capable, marginal, or needs improvement.
Want to calculate Cp and Cpk instantly? Enter your process data below and get immediate results.
Process Capability Calculator (Cp & Cpk)
Summary
Process Capability (Cp, Cpk) is a critical tool in quality management that helps organizations evaluate how well their processes perform against defined specifications. It enables businesses to measure both the variation within a process (Cp) and how well the process is centered within acceptable limits (Cpk).
By analyzing these indices, organizations can identify inefficiencies, reduce defects, and improve overall process stability. In practical terms, a high Cp and Cpk indicate a reliable and well-controlled process that consistently meets customer expectations. Therefore, understanding and regularly monitoring process capability is essential for achieving operational excellence, maintaining product quality, and driving continuous improvement in both manufacturing and service industries.
If one line must be remembered, it is this: Cp tells you what the process could do, while Cpk tells you what the process is actually doing. Together they provide one of the most useful windows into process performance, making them essential for engineers, quality teams, Lean Six Sigma practitioners, and operations leaders.
I hope this blog helped in understanding the basic concept in a simplified manner, watch out for more such stuff in the future.
Continue Your Learning Journey
Learning is a continuous process. Explore related topics, practical guides, tools, calculators, templates, and learning resources to expand your knowledge and develop new skills.
Choose a category below to explore practical tutorials, tools, calculators, templates, case studies, and learning resources.
Recommended Learning Resources
Expert-led courses to build practical skills, earn credentials, and advance your career.
Recommended professional books, certification guides, and practical study resources.
Ready-to-use templates, checklists, guides, and workbooks for practical applications.
Interactive calculators for statistics, quality, engineering, analysis, and decision-making.
Interactive Z, t, Chi-Square, and F tables with critical values and distribution curves.
Discover practical tutorials, case studies, and professional resources across Quality, Lean Six Sigma, Project Management, Statistics, AI, and Data Analytics.
Published: May 18, 2026
Last Updated: September 18, 2026