Student’s t-Table Calculator
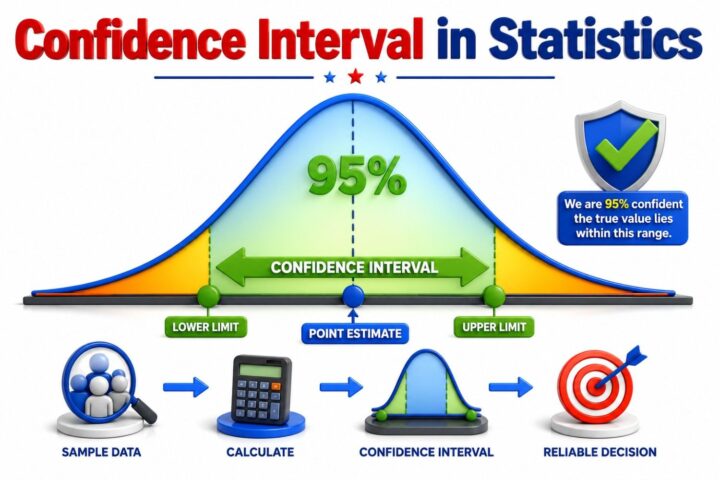
Find critical t-values using degrees of freedom, confidence level, and tail type. View the corresponding probability region on an interactive Student’s t distribution curve.
Student’s t Distribution
At 24 degrees of freedom, the t distribution has slightly heavier tails than the standard normal distribution.
Find a Critical t-Value
Results
What this result means
For 24 degrees of freedom and a 95% two-sided confidence level, the critical boundaries are approximately −2.0639 and +2.0639.
View Step-by-Step Solution
Try an Example
Degrees of Freedom
For a one-sample t-test or confidence interval, subtract one from the sample size to calculate the degrees of freedom.
aCritical t-Value
The critical t-value defines the boundary between the selected central confidence region and the tail region of Student’s t distribution.
- Higher confidence produces a larger critical value.
- Lower degrees of freedom produce heavier tails.
- As df increases, the t distribution approaches normal.
What Is a t-Statistic?
A t-statistic measures how far a sample estimate is from a hypothesized value in units of estimated standard error. Student's t distribution is commonly used when the population standard deviation is unknown.
- x-bar = sample mean
- mu = hypothesized population mean
- s = sample standard deviation
- n = sample size
Common Critical t-Values
Positive critical values for two-sided confidence intervals.
| df | 90% | 95% | 99% |
|---|
Critical Values of Student's t Distribution
Values are rounded to three decimal places. The Infinity row shows the standard normal limiting values.
Published: August 27, 2026
Last Updated: August 27, 2026