Introduction to Confidence Intervals
Imagine you are running a business and want to know how satisfied your customers are. You survey 100 customers and find that 80% are satisfied. Now the big question is — does this mean exactly 80% of your entire customer base is satisfied? Probably not. The reality is, your sample might not perfectly represent the entire population.
This is where confidence intervals come into the picture. Instead of relying on a single number, confidence intervals provide a range that reflects uncertainty and variability in data. In today’s data-driven world—from business analytics and healthcare to Six Sigma and quality improvement—confidence intervals play a crucial role in decision-making.
In this complete guide, we will break down confidence intervals in a simple yet deeply insightful way. By the end, you will not just understand how to calculate them but also how to interpret and apply them in real-world scenarios.
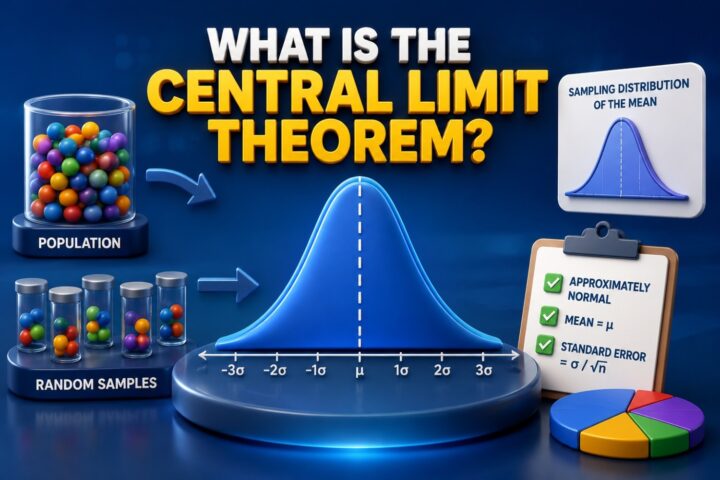
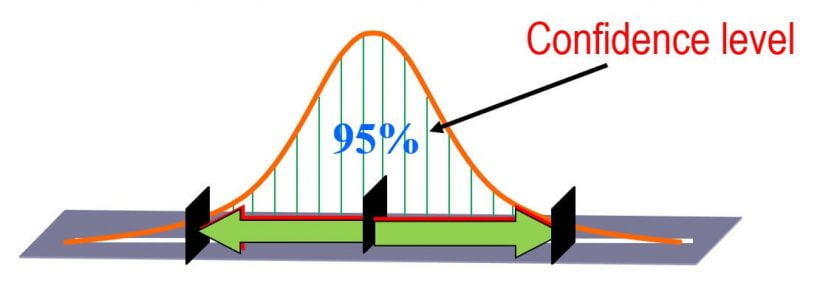
The confidence level is the degree of certainty associated with a confidence interval. Common confidence levels include 90%, 95%, and 99%. A 95% confidence level means that if you were to repeat your sampling process many times, about 95% of the calculated confidence intervals would contain the true population parameter.
Higher confidence levels provide more certainty but result in wider intervals, while lower confidence levels produce narrower intervals but less certainty.
What is Confidence Intervals ?
A confidence interval is a range of values used to estimate an unknown population parameter based on sample data. Instead of saying “the average is exactly X,” we say “the average is likely between X and Y.”
Think of a confidence interval as a safety cushion around your estimate. It acknowledges the fact that your sample is not perfect and provides a realistic window where the true value likely lies.
For example, if a survey shows that the average salary is $50,000 with a 95% confidence interval of $48,000 to $52,000, it means the true population average is likely within that range.Confidence intervals (CIs) are fundamental in statistics, providing a range within which we expect a population parameter to fall. Understanding CIs is crucial for making informed decisions based on sample data. This guide will walk you through the basics, calculations, interpretations, and applications of confidence intervals.
A confidence interval is a range of values, derived from a sample, that is likely to contain the true population parameter. Instead of providing a single estimated value, confidence intervals offer an estimate with an associated level of certainty.
Why Confidence Intervals Matter
Confidence intervals are powerful because they go beyond simple averages. In real-world applications, decisions based on a single number can be misleading. Confidence intervals help quantify uncertainty, making results more reliable and actionable.
In industries like healthcare, for example, a drug might show a 10% improvement in patient outcomes. But without knowing the confidence interval, we cannot judge how stable or reliable that improvement is.
In Six Sigma and process improvement, confidence intervals help assess process capability, variation, and reliability. They enable engineers and analysts to make evidence-based decisions instead of relying on assumptions.
Understanding the Concept of Sampling
To understand confidence intervals, we first need to understand sampling. A population refers to the entire group you are interested in studying, while a sample is a subset of that population.
Since it is often impossible or impractical to measure an entire population, we rely on samples. However, different samples can produce slightly different results, and this variation is called sampling variability.
Confidence intervals capture this variability and express it in the form of a range.
Key Components of Confidence Intervals:
- Point Estimate: The best single estimate of the population parameter (e.g., sample mean or proportion).
- Margin of Error (MOE): The range added and subtracted from the point estimate.
- Confidence Level: The probability that the confidence interval contains the true population parameter (commonly 90%, 95%, or 99%).
- Standard Error: A measure of variability in the sample estimate.
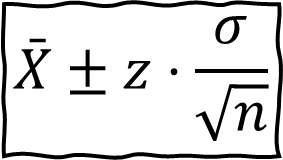
The general formula for a confidence interval is: Confidence Interval = Point Estimate ± Margin of Error
Before we understand the confidence Interval, let us first understand what do we mean by “Estimate“. Everyone makes some kinds of estimates at some point of time in their life. Imagine that you are crossing the road, and you see the car that is approaching you fast and now you can estimate the speed of that same car that is approaching you. Based on this estimate you can make your decision if you to wait, walk or run. This is called Estimate.
Now let’s define the Estimate in statistical terms. Estimate is a specific observed numerical value used to estimate an unknown population parameter or gives you some facts about how the population could be. We can have two types of estimates about the population.
Point Estimate and Interval Estimate :
Point Estimate
Suppose we have some population and we take a sample from this population and measure their weights estimate mean.
Average weight is 60 Kg. Then 60 kgs of sample mean is a Point estimate of a population mean.
Point estimate is often insufficient because its is either wrong or right. Assuming that we know its is wrong, but you don’t know how wrong it it. And you cannot be certain of estimate reliability. Assuming we came of know that you are off target by 5 kg, then you would expect 60k as good estimate but if the estimate is off by 30kg then it is not the right estimate of population.
Also the point estimate is going to be different from the population parameter because due to the sampling error, and there is no way to know who close it is to the actual parameter. For this reason, statisticians like to give an interval estimate which is a range of values used to estimate the parameter.
Interval Estimate
Because a point estimates is a single value, we can’t really tell how good it represents the population. So in inferential statistics, we prefer to use an interval or a range of values to estimate the population parameter. It gives you the range of values by calculating two different numbers between which we can expect the parameter to lie. So we construct Interval estimate with degree of certain degree of confidence say for e.g. 95% confidence.
Confidence Interval
Confidence interval is the range of estimate we are making.
Don’t confuse confidence interval with confidence levels. Confidence levels are normally expressed as % ( For e.g. 95 % confidence level). A confidence interval communicates how accurate our estimate is likely to be. We use a confidence interval to express the range in which we are pretty sure the population parameter lies. These confidence Interval give us an idea about the size and thus the power of a study.
The size of the confidence interval is then directly related to the size of the study. The more participants the smaller the confidence interval and the more precise the estimated effect. In essence, the confidence interval estimate for a population mean lies between the sample mean – the margin of Error and the sample mean + the margin of Error.
The margin of error is calculated based on a confidence level. The confidence level basically refers to the percent of confidence intervals (from many samples) that we expect to contain the true population parameter.
Interpreting Confidence Intervals
A wider CI suggests more uncertainty, while a narrower CI suggests greater precision.
A 95% CI means that if we took many samples and computed the interval each time, about 95% of those intervals would contain the true population parameter.
Confidence levels of 90%, 95%, and 99% are often used, but 95% is the most commonly used confidence level. Most of times confidence intervals can be found using the t-distribution (When you are working with smaller number of samples.
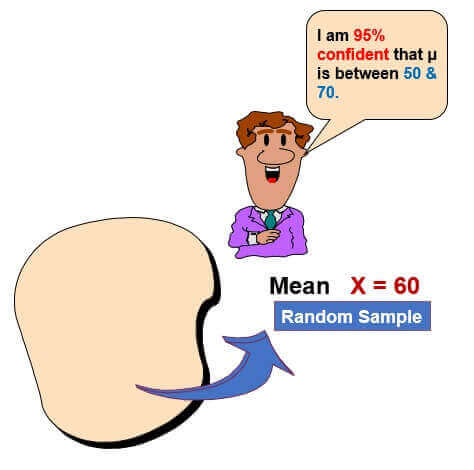
Say for e.g we are 95 % confident that True mean will lie between 40 and 60. It indicates the error in two ways one by the extent of its range and other by probability of true population parameter lying within the range. Interval Estimates of population parameters are often called Confidence Intervals.
So 95% confidence interval is a range of values that you can be 95% certain contains the true mean of the population. The correct interpretation of a 95% confidence interval is that “we are 95% confident that the population parameter is between 50 and 70.”
Inference is when we draw conclusions about the population from the sample. Because the sample was only a selection of objects from the population, it will never be a perfect representation of the population.
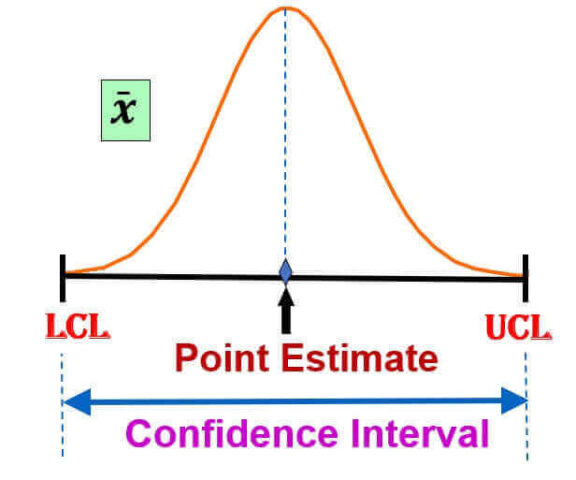
Confidence Interval is the most common type of interval estimate is made of two elements :
Confidence Interval = “Point estimate” +/- “Margin of Error”
Where Margin of errors are the upper and Lower limits of confidence Interval.
Now we can think let’s choose high confidence level say for e.g. 99% in all your estimation. But in practice, high confidence levels will produce large confidence intervals and they will end up giving very different estimates. Statisticians prefer interval estimate over point estimate because interval estimate are often accompanied with degree of confidence.
How to Calculate a Confidence Interval
To compute a confidence interval, follow these steps:
Step 1: Identify the Sample Data
Determine the sample mean (μ), standard deviation (s), and sample size (n).
Step 2: Select the Confidence Level
Common confidence levels are:
- 90% (z = 1.645)
- 95% (z = 1.96)
- 99% (z = 2.576)
Step 3: Calculate the Standard Error (SE)
SE = s / √n (for mean) SE = sqrt[(p(1 – p)) / n] (for proportion)
Step 4: Compute the Margin of Error (MOE)
MOE = z * SE
Step 5: Determine the Confidence Interval
CI = Point Estimate ± MOE
Let’s understand this with some Scenarios:
Scenario #1
John : Will I get my Television within 1 year ?
Manager : I am absolutely certain that you will get in 1 year
Confidence level : Better than 99%
Confidence Interval : Would be 1 year
Scenario #2
John : Will I get my Television within 1 month ?
Manager : I am absolutely positive that you will get in 1 month
Confidence level : Better than 95%
Confidence Interval : Would be 1 month
Scenario #3
John : Will I get my Television within 1 week ?
Manager : I am positive that you will get in 1 week
Confidence level : Better than 80%
Confidence Interval : Would be 1 week
Scenario #4
John : Will I get my Television within 1 day ?
Manager : I can try that you will get in 1 day
Confidence level : Better than 30%
Confidence Interval : Would be 1 day
Scenario #5
John : Will I get my Television within 1 Hour ?
Manager : I can try but highly unlikely that you will get in 1 hour
Confidence level : Better than 5 %
Confidence Interval : Would be 1 hour
——————————————————————————————————————————————————-
Let’s understand this with some examples:
Example 1 : CI for Single population Mean
A random sample of n = 50 males showed a mean average daily intake of dairy products equal to 756 grams with a standard deviation of 35 grams. Find a 95% and 99% confidence interval for the population average U ?
Ans: x ̄ = 756 grams ; n= 50 , σ = 35 ,
The Z-value can be derived from the table and its shows us which area is contained in the confidence interval of our result so in case of the 95% confidence interval we take although use between minus 1.96 times and plus 1.96 times the standard deviation. A lower confidence interval will lead to a lower Z-value and a smaller interval and vice versa
From Z table for 95 % confidence interval we get value as 1.96.
=> Interval estimate is = 756±1.96×35/√50
=> 746.30 ≤ m ≤ 765.70 grams for 95 % confidence interval
Now for 99 % confidence interval and From Z table for 99 % CI we get value as 2.576
=> 756±2.576×35/√50
=> 743.23 ≤m≤ 768.77 grams for 99 % confidence interval.
——————————————————————————————————————————————————-
Example 2 : CI for Single population Proportion
Billing statement for 1000 patients discharged from a particular hospital were randomly selected for error. Out of 1000 billing statements, 102 were found to contain errors. Using this formation lets construct 99% confidence interval ?
Ans: p ̂ = 102 / 1000 = 0.102
From Z table for 99 % confidence interval we get value as 2.576


p ̂ = is random and varies from sample to sample
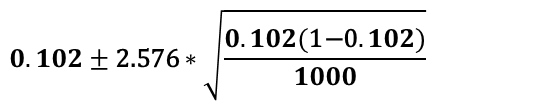
0.077 ≤p ̂≤0.127for 99 % confidence interval
——————————————————————————————————————————————————-
Watch this YouTube video for detailed explanation :
FAQ on Confidence Interval:
What is a confidence interval?
It is a range that estimates a population parameter based on sample data.
Why is 95% confidence most common?
It offers a practical balance between accuracy and precision.
Does a higher confidence level mean better accuracy?
Not necessarily—it increases certainty but widens the interval.
How does sample size affect confidence intervals?
Larger samples produce narrower and more reliable intervals.
Where are confidence intervals used in real life?
They are used in surveys, research studies, business forecasting, and quality improvement.
What does 95% confidence interval mean ?
95% CI means that there’s a 95% chance that the true mean is within the range. Larger sample size will result in a narrower confidence interval.
Conclusion
Confidence intervals are one of the most valuable tools in statistics. They move us beyond single-point estimates and provide a realistic understanding of uncertainty. Whether you are analyzing customer data, running a Six Sigma project, or interpreting survey results, confidence intervals help you make smarter, data-driven decisions.
By understanding both the concept and application of confidence intervals, you gain a powerful advantage in interpreting and using data effectively.Confidence intervals are a vital statistical tool for estimating population parameters with a degree of certainty. By understanding their calculation, interpretation, and application, you can make more informed decisions in various fields. Mastering CIs enhances analytical skills and aids in making data-driven conclusions.
For questions please leave them in the comment box below and I’ll do my best to get back to those in a timely fashion. And remember to subscribe to Digital eLearning YouTube channel to have our latest videos sent to you while you sleep.
I hope this blog helped in understanding the basic concept in a simplified manner, watch out for I hope this blog helped in understanding the basic concept in a simplified manner, watch out for I hope this blog helped in understanding the basic concept in a simplified manner, watch out for more such stuff in the future.
📚 Where Should I Go After Learning This Statistics Concept?
Understanding one statistical concept is just the beginning. Statistics works best when you connect related topics together. Continue your learning journey with these beginner-friendly guides that explain essential statistical concepts used in Six Sigma, Quality Engineering, Data Analysis, and Process Improvement.
- Descriptive statistics Vs Inferential statistics
- Central Limit Theorem & Law of large numbers
- Confidence Intervals
- Sampling in Statistics
- Scales of Measurement in Statistics
About the Author
Aman is the Founder of Digital E-Learning and a Quality & Continuous Improvement professional with more than 25 years of experience across the Automotive, Medical Device, Manufacturing, and Consulting industries. Throughout his career, he has led and contributed to numerous initiatives in Lean Six Sigma, Quality Engineering, Risk Management, Design Assurance, Process Improvement, Problem Solving, and Operational Excellence, helping organizations enhance quality, improve efficiency, and deliver greater customer value.
Drawing on extensive real-world industry experience, Aman focuses on simplifying complex concepts into practical, easy-to-understand learning resources. His content combines proven methodologies, industry best practices, and hands-on examples to help students, engineers, quality professionals, and business leaders apply these concepts effectively in their day-to-day work.
In addition to his professional experience, Aman is the creator of the Digital E-Learning YouTube channel, a trusted learning platform followed by over 100,000 subscribers worldwide. Through his articles and videos, he shares practical knowledge in Lean Manufacturing, Six Sigma, Quality Management, Statistics, Microsoft Excel, Project Management, and Continuous Improvement.
Published: June 18, 2021
Last Updated: July 11, 2026