
What is Sampling in Statistics? How to Choose the Right Sampling Method
Data-driven decisions are only as good as the data behind them. Whether you’re conducting market research, evaluating process performance, studying customer behavior, or analyzing quality metrics, collecting information from every possible source is rarely practical. Instead, organizations rely on a smaller subset of data to gain insights and make informed decisions.
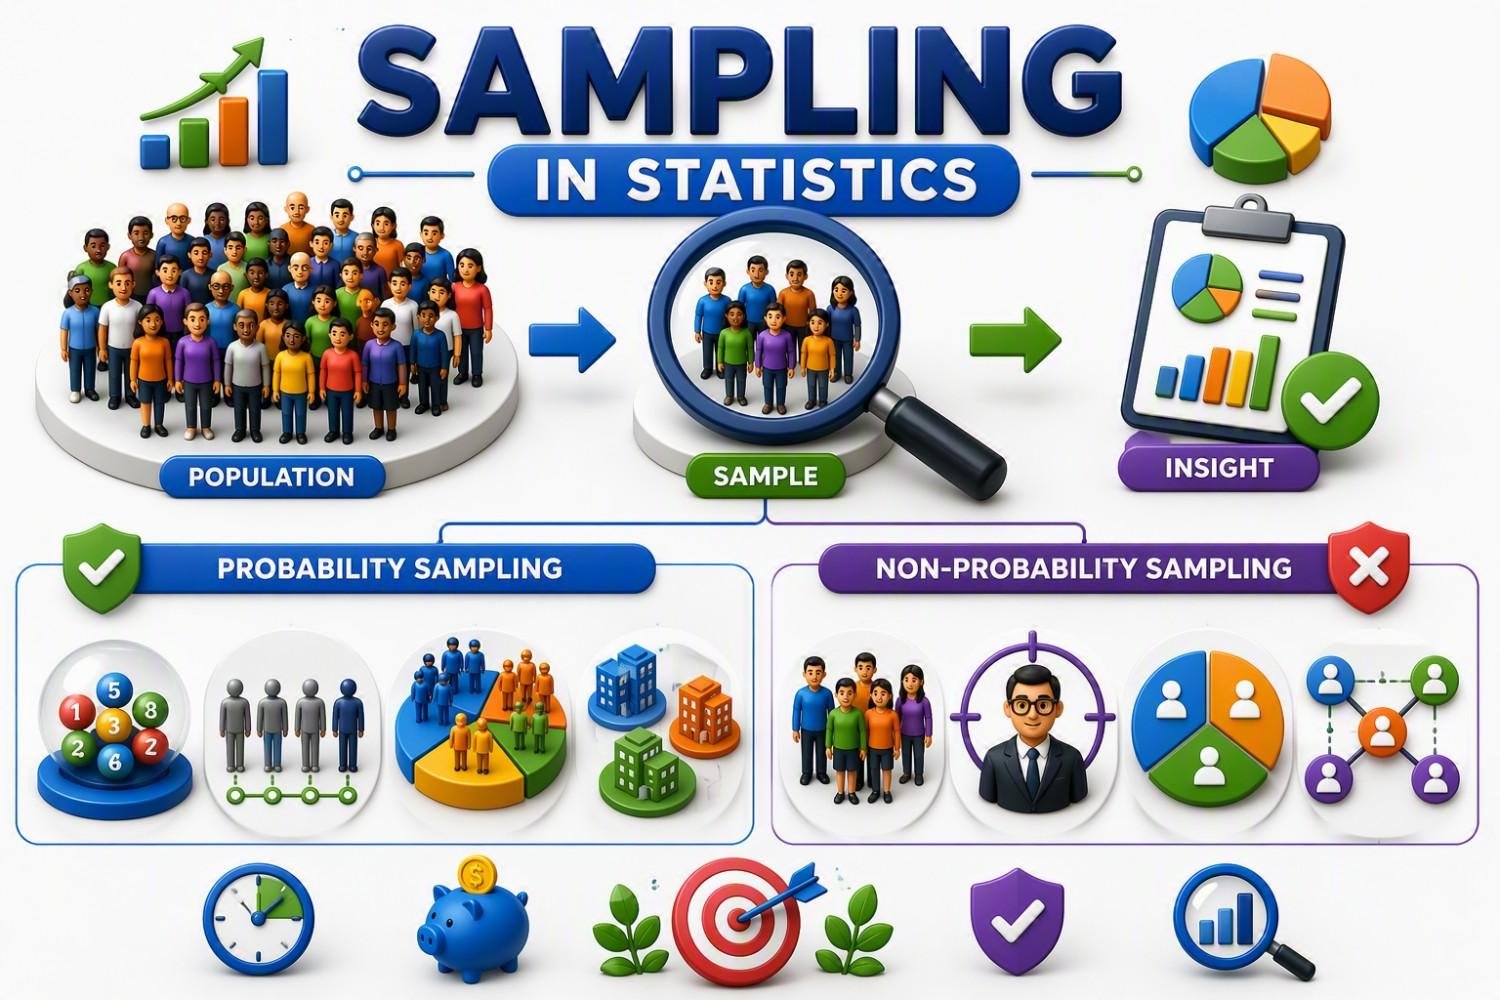
However, not all sampling approaches are created equal. Different situations require different sampling methods, and selecting the wrong approach can introduce bias, reduce accuracy, and affect the reliability of conclusions. Understanding the strengths, limitations, and appropriate applications of various sampling techniques is therefore essential for effective statistical analysis.
In this guide, you’ll learn the major sampling methods used in statistics, the differences between probability and non-probability sampling, and how to select the most appropriate approach for your specific objectives, data requirements, and decision-making needs.
Why Sampling Matters More Than You Think
Sampling is often treated as just a statistical step—select a few data points, perform analysis, and draw conclusions. In reality, it is one of the most important decisions that determines whether your analysis reflects reality or leads you in the wrong direction. I have seen teams spend significant time analyzing data but overlook a more fundamental question: “Did we collect the right data from the right sources?” A sophisticated statistical tool cannot correct a sample that does not represent the actual process.
For example, during a process improvement activity, a team may conclude that a production line is performing well based on inspection results. However, if the data was collected only during ideal operating conditions—such as the beginning of a shift—the sample may not capture issues caused by tool wear, process variation, or changing conditions later in production. The analysis may be accurate, but the conclusion can still be wrong because the sample was not representative.
This principle applies everywhere—not only in manufacturing. Businesses use samples to understand customer feedback, researchers use samples to study populations, and quality professionals use samples to monitor processes. The goal is not to collect the most data; it is to collect the right data that represents the situation you are trying to understand.
A common mistake is assuming that a larger sample always means better results. A large biased sample can still produce misleading conclusions. The sampling method matters because it influences accuracy, reliability, and confidence in the decisions we make.
Whether you choose probability sampling methods like simple random sampling, systematic sampling, stratified sampling, and cluster sampling, or non-probability sampling methods based on specific needs, the right approach depends on your objective, population, and level of accuracy required.
Before trusting any chart, report, or statistical conclusion, always ask one question: “How was the sample selected?”
Because the quality of your conclusions can never be better than the quality of the sample behind them.
What is Sampling in Statistics?
After more than 25 years working in manufacturing, quality engineering, medical devices, and continuous improvement, one thing I have learned is that good decisions depend on good data—and good data starts with good sampling.
In statistics, sampling means selecting a smaller group of observations, known as a sample, from a larger group, called a population, to understand trends, measure performance, and make decisions without analyzing every single item.
In real-world situations, studying an entire population is often not practical. For example, a manufacturing company producing thousands of products every day cannot inspect every unit before making quality decisions. Instead, engineers collect data from a carefully selected sample to understand how the overall process is performing. The accuracy of those conclusions depends on one important factor: does the sample truly represent the population?
I have seen situations where teams had plenty of data but still reached the wrong conclusion because the data collection approach was not appropriate. The issue was not the analysis method or statistical software—the problem was that the sample did not capture the real variation in the process. A simple way to understand sampling is to think about tasting food while cooking. You do not need to eat the entire dish to know its taste; you need a small portion that represents the whole dish. However, if the sample is taken from only one area, the conclusion may not reflect the actual result.
Sampling is used everywhere—from quality improvement and customer surveys to healthcare research and business analysis. A well-selected sample helps organizations save time, reduce cost, and make reliable decisions. On the other hand, a biased sample can create misleading results, even when the calculations are performed correctly.
One important lesson I have learned is that more data does not always mean better data. A smaller, carefully selected sample can provide better insights than a large amount of poorly collected information. Before trusting any report, dashboard, or statistical conclusion, always ask:
“How was the sample selected?”
Because the quality of any statistical decision can never be better than the quality of the sample behind it.
Population vs Sample
One of the first things I explain in my Six Sigma and quality engineering training is the difference between a population and a sample. From my experience, once people understand these two terms, choosing the right sampling method becomes much easier.
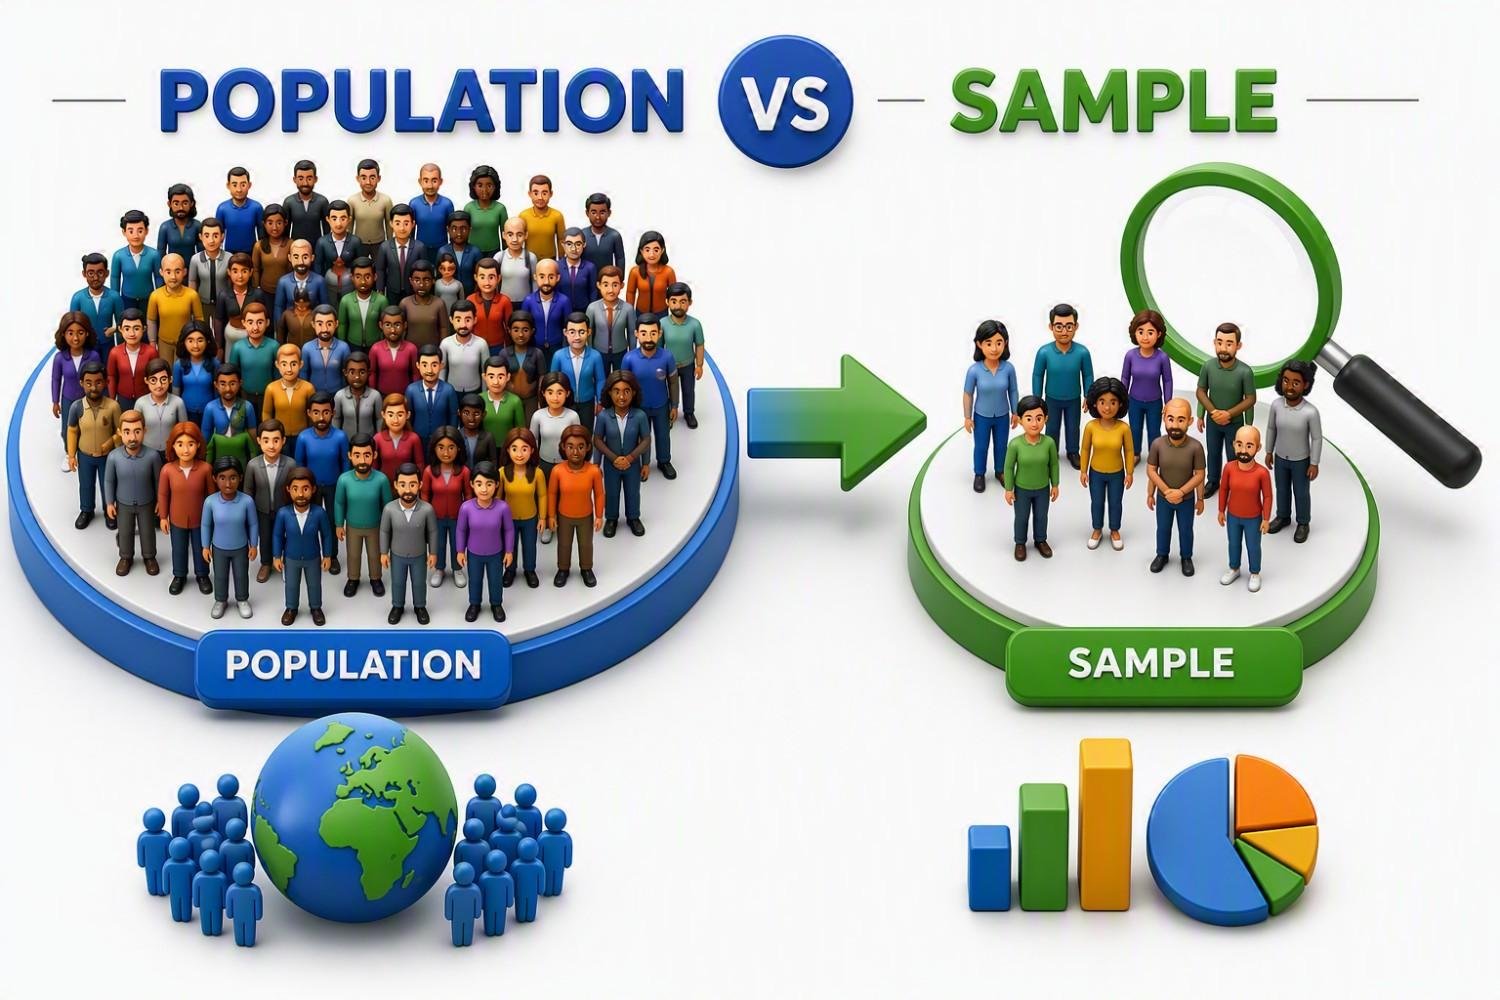
A population is the complete set of people, products, or observations you want to study, while a sample is a smaller group selected from that population. In theory, analyzing the entire population would provide the most complete picture. In practice, it is rarely feasible because of time, cost, and resource constraints. A production line may produce thousands of components every day, but inspecting every single one would slow operations and add unnecessary cost. Instead, we inspect a carefully selected sample and use those findings to assess the overall process. When the sample accurately represents the population, the decisions we make are usually reliable.
Understanding the relationship between a population and a sample is the foundation of statistics. Every sampling method you will learn next is designed with one goal in mind: to select a sample that represents the population as accurately as possible.
In simple terms:
Sample = Small portion selected for analysis. Sample is a small group selected from a population to represent the entire population. Since sample is drawn from the population, so we can say it is a part or a subset of the population.
Population = Entire group (e.g., all customers). Sample is drawn from Population. Let understand with some real-life examples. Millions around the world are infected because of this of COVID -19. And many companies are doing the clinical trials. So they select small portion of people from different background probably age, gender who are infected with COVID 19 as sample and then will perform a study on these. These samples would represent millions of people who are infected worldwide. Because it is not possible to conduct test on Millions of individuals.
Why do we use Sampling?
Why don’t we just study the entire population?” My answer is always the same: in the real world, that’s rarely practical. Whether you’re inspecting products, surveying customers, or conducting research, collecting data from every single observation takes significant time, effort, and money. I’ve worked on manufacturing projects where thousands of products were produced every day. Inspecting every unit would have slowed production without adding much value. Instead, we used a statistically sound sampling plan to monitor quality and make decisions quickly. When the sample truly represented the process, the results were reliable enough to identify problems, improve performance, and maintain product quality.
Over the years, I’ve learned that sampling isn’t about collecting less data—it’s about collecting the right data. A well-selected sample can provide better insights than a large amount of poorly chosen information. That’s why sampling is widely used across manufacturing, healthcare, market research, finance, and scientific studies.
The biggest advantage of sampling is that it helps us balance accuracy, speed, and cost. It allows us to understand a large population without measuring every individual item, making data-driven decisions both practical and efficient.
In my experience, the success of any analysis depends less on how much data you collect and more on how well your sample represents the population. Get the sample right, and you’re far more likely to get the decision right.
🎓 Top-Rated Courses & Certifications
Try changing your filters or searching for another course.
Types of Sampling in Statistics.
Sampling methods are broadly classified into two categories: Probability Sampling and Non-Probability Sampling. There isn’t a universal “best” method—the right choice depends on what you’re trying to achieve, how your population is structured, the resources available, and the level of confidence you need in your results.
One lesson I’ve learned from years of working on quality improvement and Six Sigma projects is that choosing the right sampling method is often more important than collecting more data. A well-planned sampling strategy can produce reliable insights with less effort, while the wrong approach can lead to misleading conclusions regardless of how much data you collect.
Understanding the strengths and limitations of each sampling method helps you select data that truly represents the population, leading to more accurate analysis and better-informed decisions.
Probability Sampling in Statistics
If I need data that I can confidently use to make decisions, probability sampling is my first choice. In probability sampling, every member of the population has a known and non-zero chance of being selected through a random process. This doesn’t mean selecting items randomly without a plan. It means following a structured method that gives every eligible member a fair opportunity to be included. That simple principle helps reduce selection bias and makes the findings more reliable.
Simple Random Sampling
If someone asks me where to start with probability sampling, I almost always recommend Simple Random Sampling (SRS). It’s easy to understand, straightforward to implement, and teaches one of the most important principles in statistics: every member of the population deserves an equal chance of being selected.
In Simple Random Sampling, each individual, product, or observation has an equal and independent probability of being chosen. The selection is based on a random process—not convenience or personal judgment—which helps reduce selection bias and makes the sample more representative of the population.
Example:
A simple example is randomly selecting 100 products from a production lot or 500 customer IDs from a database using a random number generator. Since every item has the same chance of being selected, the results are more likely to reflect the true characteristics of the population.
From my experience, Simple Random Sampling works best when you have a complete list of the population and the population is relatively homogeneous. It may not always be the most practical method, but when fairness, objectivity, and statistical reliability are the priority, it remains one of the most trusted sampling techniques.
Systematic Sampling
Among all the probability sampling methods I’ve used in manufacturing and Six Sigma projects, Systematic Sampling has probably been the most practical. In fast-moving production environments, stopping to randomly select every item isn’t always realistic. Instead, selecting every kth item after a random starting point provides a simple, repeatable process that works well without disrupting operations.
Example:
For example, if a factory needs to inspect 100 products from a batch of 5,000, it might randomly select the 18th product as the starting point and then inspect every 50th product until the required sample size is reached. This spreads the sample across the entire production run instead of concentrating it in one area.
Stratified Sampling
In stratified sampling, we divide the population into groups also known as Strata. Then within each Strata, you can select samples randomly. We normally use this technique when population has mixed characteristics. You can divide the population based on (Age, Gender, Zone, Income etc.) Whenever I work with data from different production lines, shifts, suppliers, or customer groups, I rarely treat them as one large population. Over the years, I’ve learned that combining very different groups into a single sample can hide important patterns. That’s where Stratified Sampling has consistently helped me make better decisions.
In Stratified Sampling, the population is first divided into similar groups (called strata) based on a shared characteristic, such as department, age, region, production line, or shift. A random sample is then selected from each group, ensuring every important segment is represented in the final analysis.
I remember investigating a manufacturing process that looked stable when we reviewed the overall data. Once we separated the data by production shift and sampled each shift individually, one shift showed a much higher defect rate than the others. The overall average had hidden the problem. That experience taught me that breaking data into meaningful groups often reveals insights that a single overall sample cannot.
Example:
For example, if a company has 1,000 employees—700 in Production, 200 in Sales, and 100 in HR—a stratified sample selects participants from each department, usually in proportion to its size. This produces a sample that reflects the actual workforce rather than leaving representation to chance.
Cluster Sampling
Cluster Sampling works best when the population is spread across multiple locations and collecting data from every location isn’t practical. I’ve used this approach in projects involving multiple manufacturing sites, where visiting every plant would have required significant time and cost. Instead of selecting individuals from the entire population, we randomly selected a few sites and collected data within those locations.
In Cluster Sampling, the population is divided into natural groups (clusters) such as factories, schools, hospitals, cities, or retail stores. A random sample of these clusters is then selected, and data is collected from the chosen clusters. This makes large-scale studies much more manageable
Example:
For example, if a company operates 50 factories nationwide, it might randomly select 10 factories and evaluate employees or products only within those locations instead of sampling from all 50 factories.
From my experience, Cluster Sampling is the right choice when efficiency, cost, and logistics are major considerations. While it may not be as precise as Stratified Sampling, it is an effective and practical method for studying large, geographically dispersed populations.
Non-Probability Sampling in Statistics
Not every study begins with a perfect list of the population or enough time to conduct a carefully randomized survey. In the real world, deadlines, budget constraints, and limited access to data often force us to be more practical. This is where Non-Probability Sampling becomes useful. Unlike probability sampling, where every member of the population has a known chance of being selected, non-probability sampling relies on factors such as accessibility, expertise, judgment, or referrals. While it may not provide the same level of statistical confidence, it can still deliver valuable insights when used for the right purpose.
I learned this early in my career while working on a manufacturing process improvement project. The team wanted to understand why operators were struggling with a newly introduced procedure. We didn’t have the luxury of designing a large-scale randomized study, nor did we need one. Instead, we spoke directly with operators who worked with the process every day. Technically, this was a form of non-probability sampling because participants were selected based on their availability and experience rather than random selection. Within a few hours, we identified several training gaps and procedural issues that had been slowing down production for weeks. In that situation, speed and insight mattered more than statistical precision.
Non-probability sampling is a method where not every individual has an equal or known chance of being selected. Non-Probability sampling is opposite of Probability sampling. Here it involves non random or picked based on convenience.
Convenience Sampling
Among all non-probability sampling methods, Convenience Sampling is undoubtedly the simplest and most commonly used. As the name suggests, participants or items are selected because they are easy to access, readily available, or conveniently located. There is no random selection process involved. Instead, researchers collect data from whoever or whatever is easiest to reach at that moment.
Samples are selected based on ease of access. In convenience sampling, we select samples based on convenience. Sometimes we also call it accidental Sampling Say for e.g. we select samples based on availability and their willingness.
Example:
Imagine a coffee shop owner wants quick feedback about a new menu item. Instead of surveying every customer throughout the month, the owner simply asks the first 30 customers who walk into the shop on a Monday morning.
This is Convenience Sampling because the sample is chosen based on who is easiest to reach rather than through a random selection process.
Purposive Sampling
Purposive Sampling, also known as Judgmental Sampling, is a non-probability sampling method in which participants are selected because they possess specific knowledge, skills, experience, or characteristics that are relevant to the study. Instead of choosing people randomly, the researcher deliberately selects individuals who are most likely to provide valuable insights.
In my experience, Purposive Sampling is extremely useful when the goal is not to understand what everyone thinks, but rather to learn from people who have direct expertise or firsthand experience. During a process improvement project, I once needed to understand the root causes of recurring production delays. Rather than interviewing employees across the entire factory, I focused on production supervisors, machine operators, and maintenance technicians who were directly involved in the affected process. Their insights helped identify the problem much faster than a broad survey ever could. This was a classic example of Purposive Sampling—selecting people because of what they knew, not because they were randomly chosen.
Example:
During a root cause investigation involving recurring product failures, I didn’t need opinions from every employee in the plant. What I needed were insights from the people closest to the problem. We specifically interviewed the operators running the process, the maintenance technician responsible for the equipment, and the quality engineer reviewing defect trends. Their experience helped identify the root cause within days.
This was a classic example of Purposive Sampling. The goal wasn’t to represent the entire workforce—it was to gather knowledge from the people most qualified to explain what was happening.
Snowball Sampling
Snowball Sampling is a non-probability sampling method where existing participants help identify and recruit additional participants for the study. The sample grows gradually—much like a snowball rolling downhill and becoming larger over time. This method is particularly useful when researching hard-to-find populations or groups that cannot be easily identified through traditional sampling methods.
Participants refer others to the study.
Example:
A researcher wants to study the experiences of Lean Six Sigma Master Black Belts in the healthcare industry. Since there is no complete list of all professionals in this niche field, the researcher starts by interviewing five Master Black Belts they already know.
At the end of each interview, the participants are asked: “Can you recommend other experienced Master Black Belts who would be willing to participate?” Those new participants then recommend additional experts, and the sample gradually grows through referrals.
This is Snowball Sampling because existing participants help recruit future participants.
Quota Sampling
In quota sampling, sample is selected on based on some particular traits or qualities Say for e.g. company wants to find out what age group of people prefer particular brand of mobile. We divide the population based on quota on the basis of age say 10-19 , 20-30, 30-40, 40 above. Samples are selected to meet predefined quotas.
Example:
A smartphone company wants to survey 200 customers about a new mobile app. The company decides the sample should include:
- 100 Male customers
- 100 Female customers
Researchers then approach customers in shopping malls, cafés, and stores until each quota is filled. Once 100 males and 100 females have been surveyed, data collection stops.
✅ This is Quota Sampling because specific categories (quotas) are predefined, but participants within each category are selected non-randomly.
📚 Recommended Books for Professionals
Try removing one or more filters.
Probability vs Non-Probability Sampling (Key Difference)
👉 Probability sampling is used for scientific accuracy, while non-probability sampling is used for quick insights.
Real-World Case Study
Early in my career, I worked on a quality improvement project at an automotive manufacturing plant where a team was investigating an increase in paint defects on vehicle doors. The quickest option was to inspect only the vehicles parked in the final inspection area because they were easy to access. While this Convenience Sampling approach could help identify obvious issues, I knew it wouldn't tell us whether the problem existed across the entire production process.
Since the objective was to estimate the actual defect rate and identify the root cause, we switched to a Probability Sampling approach. We used Stratified Sampling, dividing production by shift and paint line, then randomly selected vehicles from each group. The results immediately revealed that most defects were coming from one paint line during the night shift. Until then, the overall production data had hidden the problem because good-performing shifts were averaging out the poor-performing one.
That experience taught me an important lesson I still share in Six Sigma training: the best sampling method depends on the decision you need to make. If you're exploring ideas or collecting quick feedback, a non-probability sample may be enough. But when product quality, customer satisfaction, warranty costs, or business decisions are involved, probability sampling provides far more reliable evidence.
In my experience, teams often spend weeks analyzing data but only a few minutes deciding how to collect it. Ironically, that first decision usually has the biggest impact on the quality of the final conclusion. Choosing the right sample isn't just good statistics—it's good engineering.

Lean Six Sigma • Six Sigma • Statistics • Project Management • Artificial Intelligence (AI) • Operations Management • Quality Management
Frequently Asked Questions (FAQs)
- What is sampling in statistics?
Sampling is the process of selecting a subset of individuals or observations from a larger population to draw conclusions without studying the entire population. - Why is sampling important in statistics?
Sampling saves time, cost, and effort while allowing researchers and organizations to make reliable decisions based on representative data. - What is the difference between a population and a sample?
A population includes every member of a group being studied, while a sample is a smaller subset selected from that population. - What are the main types of sampling?
Sampling methods are broadly classified into Probability Sampling and Non-Probability Sampling. - What is Probability Sampling?
Probability Sampling is a method where every member of the population has a known chance of being selected. - What is Non-Probability Sampling?
Non-Probability Sampling selects participants based on convenience, judgment, quotas, or referrals rather than random selection. - Which sampling method is the most accurate?
Probability Sampling methods, especially Stratified and Simple Random Sampling, generally provide the most representative and statistically reliable results. - What is Simple Random Sampling?
Simple Random Sampling gives every member of the population an equal chance of being selected. - What is Systematic Sampling?
Systematic Sampling involves selecting every nth member of a population after choosing a random starting point. - What is Stratified Sampling?
Stratified Sampling divides the population into subgroups (strata) and randomly samples from each group to ensure representation. - What is Cluster Sampling?
Cluster Sampling divides a population into clusters and randomly selects entire clusters for study instead of individual members. - What is Convenience Sampling?
Convenience Sampling selects participants who are easiest to access, making it quick but potentially biased. - What is Purposive Sampling?
Purposive Sampling intentionally selects individuals with specific knowledge, expertise, or experience relevant to the study. - What is Quota Sampling?
Quota Sampling ensures predefined groups are represented in the sample but does not use random selection within those groups. - What is Snowball Sampling?
Snowball Sampling uses referrals, where existing participants recruit additional participants, helping researchers reach hard-to-find populations. - What is Sampling bias?
Sampling bias occurs when certain members of a population are more likely to be selected than others, leading to misleading results. - What is a representative sample?
A representative sample accurately reflects the characteristics of the population from which it is drawn. - What sample size is needed for a statistical study?
The required sample size depends on the population size, confidence level, margin of error, and variability within the data. - When should I use Probability Sampling?
Use Probability Sampling when you need reliable, population-wide conclusions for research, quality control, business decisions, or regulatory studies. - When should I use Non-Probability Sampling?
Use Non-Probability Sampling when conducting exploratory research, gathering quick feedback, or studying hard-to-reach populations. - Can a small sample provide accurate results?
Yes. A well-selected representative sample can often produce more accurate results than a larger but biased sample. - What is the biggest mistake people make when sampling?
The most common mistake is choosing a sample based on convenience and assuming it represents the entire population. - Which sampling method is commonly used in Lean Six Sigma projects?
Simple Random, Systematic, and Stratified Sampling are commonly used in Lean Six Sigma projects because they provide reliable and actionable data. - What is the difference between Stratified and Cluster Sampling?
Stratified Sampling samples from every subgroup, while Cluster Sampling randomly selects only some groups and studies those clusters. - How do I choose the right sampling method?
The best sampling method depends on your objective, available resources, required accuracy, and whether you need statistically reliable conclusions or quick practical insights.
Summary & Conclusion
After years of working on manufacturing and Six Sigma projects, I've found that successful decisions rarely come from collecting more data—they come from collecting the right data. That's exactly why sampling is so important. It helps us understand a large population using a smaller, well-chosen sample, saving time and resources without sacrificing meaningful insights.
As you've seen throughout this guide, every sampling method has its place. The key is choosing the one that best fits your objective, your population, and the level of confidence you need. In my experience, the biggest mistakes don't happen during data analysis—they happen much earlier, when the sample fails to represent reality.
If you remember just one thing, let it be this: good statistics starts with good sampling. Get the sample right, and every analysis that follows becomes far more reliable.
Continue Your Learning Journey
Learning is a continuous process. Explore related topics, practical guides, tools, calculators, templates, and learning resources to expand your knowledge and develop new skills.
Choose a category below to explore practical tutorials, tools, calculators, templates, case studies, and learning resources.
Recommended Learning Resources
Expert-led courses to build practical skills, earn credentials, and advance your career.
Recommended professional books, certification guides, and practical study resources.
Ready-to-use templates, checklists, guides, and workbooks for practical applications.
Interactive calculators for statistics, quality, engineering, analysis, and decision-making.
Interactive Z, t, Chi-Square, and F tables with critical values and distribution curves.
Discover practical tutorials, case studies, and professional resources across Quality, Lean Six Sigma, Project Management, Statistics, AI, and Data Analytics.
Published: September 18, 2021
Last Updated: September 18, 2026

This lesson has been very helpful thank you.