What is Measurement System Analysis (MSA)? Complete Guide with Gage R&R Examples
In quality management, good decisions depend on trustworthy measurement data. A team can collect hundreds of measurements and apply sophisticated statistical tools, but if the measurement process is not reliable, the conclusions drawn from that data can still be wrong. This is easy to overlook. A calibrated instrument does not automatically mean that every measurement is dependable. The way a measurement is performed, the equipment being used, the conditions around it, and the people taking the measurements can all influence the result. In a real manufacturing environment, this can become particularly important when a small difference in measurement can change a product acceptance decision or trigger an unnecessary investigation.

Measurement System Analysis (MSA) provides a systematic way to determine whether a measurement process is capable of producing data that can be trusted for its intended use. The objective is not simply to obtain repeatable numbers, but to understand how much confidence can be placed in those numbers when making quality and process decisions.
From my experience working in quality, design assurance, and process improvement, one lesson has stood out: teams can spend significant effort investigating variation without first asking whether the measurement data itself is reliable. Establishing confidence in the measurement process early can prevent wasted analysis, avoid incorrect conclusions, and make improvement efforts far more effective. Ultimately, MSA helps establish a solid foundation for data-driven quality decisions—because before improving a process, we need to be confident that what we are measuring truly reflects what is happening.
What is Measurement System Analysis (MSA)
Measurement System Analysis (MSA) is a structured approach used to determine whether a measurement system produces reliable data that is suitable for its intended purpose. It looks beyond the instrument itself and evaluates the measurement process as a whole, helping establish confidence that the results reflect the characteristic being measured rather than unwanted measurement variation.
This matters because a measurement result is never produced by the instrument alone. The gage, operator, measurement method, part, environment, and procedures can all influence the result. Even a calibrated instrument can produce inconsistent or misleading data if other parts of the measurement process are not controlled.
A simple example makes this clear. If the same component is measured several times and the readings are different, is the component actually changing—or is the measurement process producing different results? MSA helps answer that question before the data is used to make important decisions.
From practical work in quality, design assurance, and process improvement, I have found that this is an easy step to overlook. Teams can spend considerable time investigating process variation, reviewing trends, or analyzing data without first establishing confidence in the measurement results. When the measurement system itself contributes significant variation, the investigation can head in the wrong direction.
Measurement System Analysis (MSA) is a critical part of quality management because even the best process improvement efforts can fail if measurements are not reliable. Before conducting studies such as FMEA, Root Cause Analysis (RCA), or Process Capability Analysis, it is important to verify that the measurement system is capable of producing consistent and accurate results. Use the calculator below to quickly assess your measurement system and support data-driven quality decisions
The value of MSA is therefore quite simple: it helps separate meaningful information from measurement noise and provides greater confidence in the data used for quality decisions.
At its core, MSA answers one fundamental question:
Can we trust this measurement data enough to make a decision based on it?
If the answer is yes, the data provides a stronger foundation for quality and process decisions. If the answer is no, relying on that data can lead to unnecessary investigations, incorrect conclusions, and wasted effort.
Why is MSA Important in Quality Management
Quality decisions are only as good as the data behind them. If a measurement is used to accept a product, monitor a process, investigate a problem, or confirm an improvement, we need confidence that the result represents the product or process—not the measurement system.
That is the practical value of Measurement System Analysis (MSA).
A situation I have seen in quality work is an unexpected result that immediately triggers a process investigation. The team starts looking at the machine, material, method, or process conditions. Sometimes that is exactly the right approach. But sometimes the measurement process itself is contributing to the variation.
For example, if two operators measure the same characteristic and consistently obtain different results, the difference may not be in the product at all. Acting on those numbers without first understanding the measurement system can lead to unnecessary troubleshooting, adjustments, or even rejection of acceptable product.
From my experience in quality, design assurance, and risk-management activities, one of the most useful habits is to establish confidence in the measurement data before drawing conclusions from it. This is especially important when the observed variation is small enough that measurement differences can influence the decision.
How MSA Supports Better Quality Decisions
A reliable measurement system provides a stronger foundation for several common quality activities:
- Product acceptance: Helps reduce the risk of incorrect pass/fail decisions.
- Process monitoring: Helps distinguish genuine process changes from measurement-related variation.
- Root cause analysis: Prevents unreliable measurements from sending an investigation in the wrong direction.
- Process capability analysis: Gives greater confidence that capability results reflect the process being evaluated.
- Continuous improvement: Helps determine whether an observed improvement is real and repeatable.
- Quality and regulatory decisions: Provides stronger confidence in measurement-based evidence.
The consequences of overlooking measurement-system problems can extend beyond statistics. Unreliable data may result in unnecessary rework, scrap, repeated inspections, process adjustments, or wasted investigation time. In some situations, it can also cause a genuine problem to be overlooked because the measurement variation masks what is actually happening.
There is a simple principle I use when thinking about measurement data:
Before solving a process problem, make sure the measurement system is not creating the problem you are seeing.
That is why MSA is an important part of quality management. It creates confidence in the data used for decision-making and helps quality teams focus their attention on real process and product variation, rather than chasing noise introduced by the measurement process itself.
What is a Measurement System?
A measurement system is the complete process used to obtain a measurement and turn a physical characteristic into usable data. It is not limited to the instrument in someone’s hand. The result depends on how the measurement is performed, under what conditions, and how the value is recorded.
For example, when measuring the diameter of a machined component, the measurement system may involve a digital caliper, the operator, the measurement procedure, the part setup, and the conditions in which the measurement is performed. Change one of these factors, and the reported result can change.
A useful way to look at it is:
Physical characteristic → Measurement process → Measurement result
The measurement system is everything involved in that path.
Why the Instrument is Only One Part
In day-to-day quality work, it is easy to focus on the gage and ask, “Is it calibrated?” That is certainly important, but calibration alone does not tell us whether the measurement process is working consistently. For instance, two operators can use the same calibrated instrument on the same component and obtain different readings because they position the part differently, apply different measuring force, follow the procedure differently, or use different techniques.
That is why, when I look at a measurement problem, I prefer to consider the entire measurement process rather than the instrument in isolation. A good instrument cannot compensate for an inconsistent way of using it. A measurement system can therefore be thought of as the connection between what exists physically and the number we ultimately use for a quality decision. Understanding that connection is essential before placing confidence in measurement data.
🎓 Top-Rated Courses & Certifications
Try changing your filters or searching for another course.
Sources of Variation in a Measurement System
No measurement is perfectly free from variation. The important question in MSA is whether the variation we see comes mainly from the characteristic being measured or from the measurement process itself.
This distinction matters in everyday quality work. If measurement variation is large compared with the actual variation in the product or process, the data can give a misleading picture. A process may appear unstable when it is not, or a meaningful change may be difficult to detect.
Several factors can contribute to measurement variation:
- Equipment: Instrument resolution, condition, wear, calibration status, and mechanical limitations can influence the reading.
- Operator: Different users may handle, position, or operate the equipment differently.
- Method: Differences in setup, measurement technique, fixturing, or work instructions can change the result.
- Part: Geometry, surface condition, measurement location, or part-to-part differences can affect how consistently a characteristic can be measured.
- Environment: Temperature, vibration, lighting, humidity, and cleanliness may influence certain types of measurements.
- Data handling: Rounding, recording, transferring, or processing measurements can introduce additional differences.
A Simple Example
Suppose the same component is measured several times using the same digital caliper. The caliper is calibrated, yet the readings are not identical.
It would be easy to assume that the component itself is varying. But the difference could come from how the part is positioned, how much measuring force is applied, or how the measurement is performed. This is something I pay close attention to during quality investigations: measurement variation is rarely just an equipment question. Looking at the complete measurement process often reveals factors that are easy to miss when attention is placed only on the instrument.
The practical question is therefore: Where is the variation coming from?
Understanding that source is essential before deciding what the measurement data is telling us about the product or process.
What are the Components of a Measurement System?
A measurement result is the end product of several elements working together. The measuring instrument is only one part of the measurement system. The operator, measurement method, part, environment, procedures, and even the way the result is recorded can influence the final value.
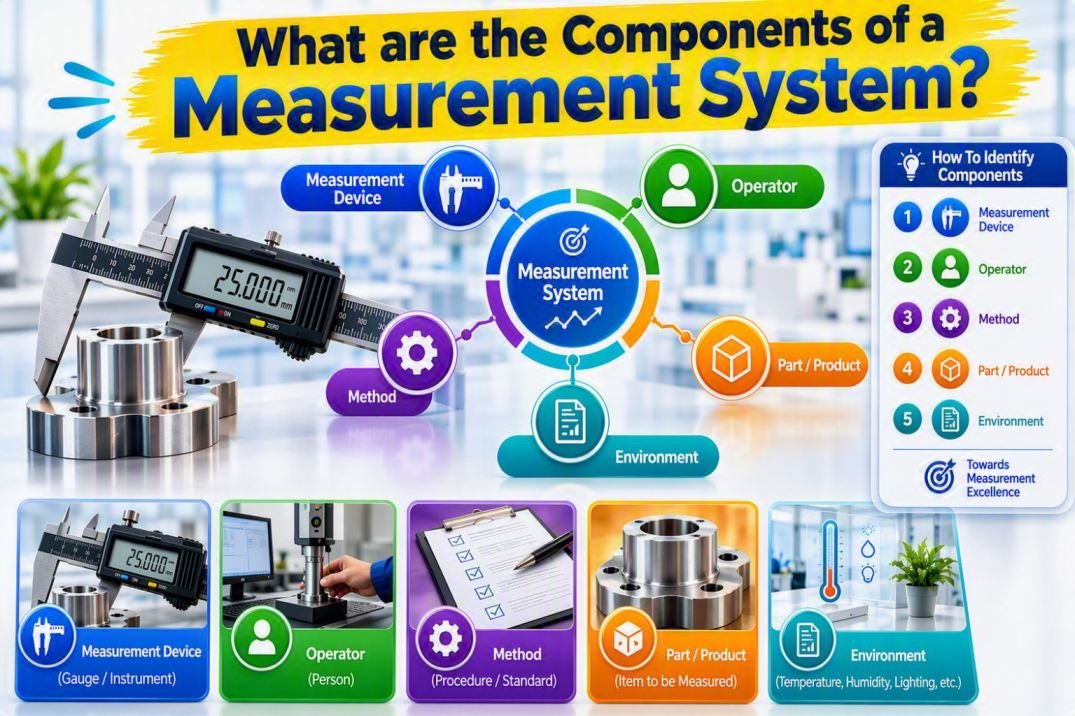
This broader view is important in practical quality work. I have seen cases where attention immediately went to the instrument because two readings did not agree, while the real difference was related to the measurement setup or technique. Looking at the complete system makes it easier to understand where a measurement problem may actually be coming from.
Measuring Equipment
The gage or measuring instrument is the device used to obtain the measurement. Common examples include calipers, micrometers, CMMs, torque testers, pressure gauges, and electronic sensors.
The equipment should be appropriate for the characteristic and level of accuracy required. A high-end instrument does not automatically guarantee a good measurement system.
Operator
The operator is another important part of the system. Knowledge, training, experience, and measurement technique can all influence the result.
For example, two people using the same calibrated caliper may position the part differently or apply different measuring force. The instrument has not changed, but the measurements may still differ.
Measurement Method
The measurement method describes how the measurement is actually performed. It can include part positioning, measurement location, setup, sequence, contact points, and the technique used.
Even a good instrument can produce inconsistent results when the method is unclear or applied differently from one measurement to another.
Part or Workpiece
The part being measured can also affect the measurement process. Features such as geometry, surface finish, flexibility, accessibility, or location can make a characteristic easier or harder to measure consistently.
This is particularly noticeable with complex or delicate components where small differences in positioning can influence the reading.
Environment
The measurement environment can affect results when the characteristic or equipment is sensitive to surrounding conditions.
Depending on the application, factors such as temperature, vibration, humidity, lighting, cleanliness, and contamination may need to be controlled.
Procedures and Instructions
Clear measurement procedures and work instructions help different people perform the same measurement in a consistent way.
In practice, an unclear instruction can create more variation than expected. Small differences in how people interpret a requirement can become noticeable when measurements are close to a specification limit.
Data Recording and Reporting
The measurement process does not necessarily end when the value appears on the instrument. Results may be manually entered, transferred to software, converted, rounded, or compared with specifications.
A simple recording or data-entry error can therefore affect an otherwise correctly performed measurement.
Measurement System at a Glance
The main takeaway is straightforward: a measurement system is the complete process used to produce a measurement, not simply the instrument used to take it. Understanding these components helps put measurement results into the right context and provides a clearer view of how the system operates.
Accuracy vs Precision in MSA
When working with Measurement System Analysis (MSA), accuracy and precision are two terms that are often used interchangeably. They are not the same. A measurement system can give very consistent readings and still be consistently wrong. Accuracy is about how close a measurement is to an accepted reference value. Precision is about how closely repeated measurements agree with one another.
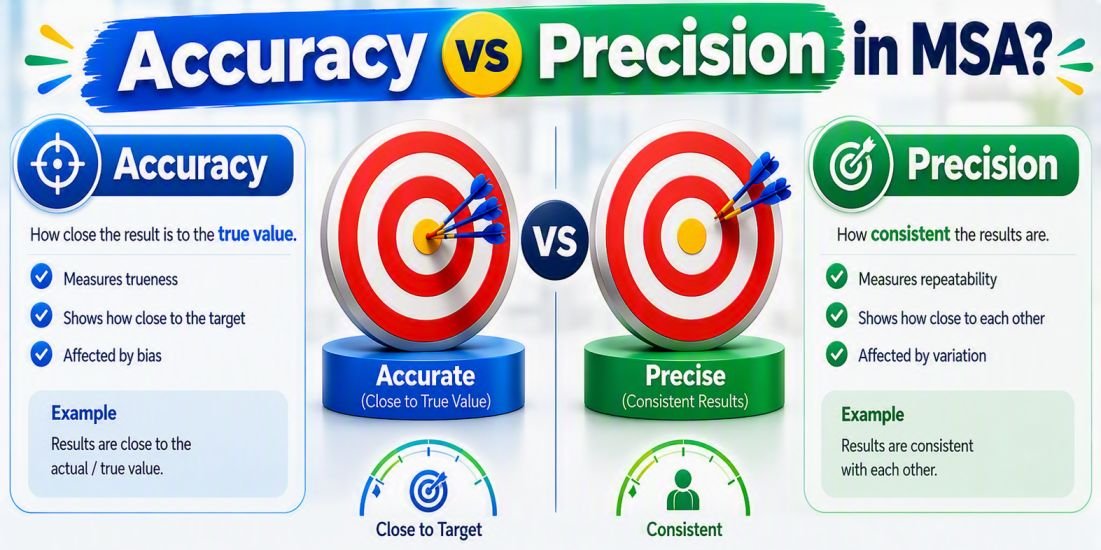
Consider a part with an accepted reference dimension of 50.00 mm.
Accuracy
Accuracy tells us how close the measurement is to the accepted or reference value.
For example, if the accepted value is 50.00 mm and the instrument repeatedly reports values around 50.00 mm, the system is showing good accuracy.
In quality work, accuracy is especially important when a measurement is being compared against a specification or reference standard. A consistently shifted measurement can lead to the wrong conclusion even when the readings look very stable.
Precision
Precision tells us how closely repeated measurements agree.
Suppose the same characteristic is measured three times and the results are 49.20, 49.21, and 49.20 mm. The readings are very close to one another, so the system is precise. However, if the accepted value is 50.00 mm, those measurements are not accurate.
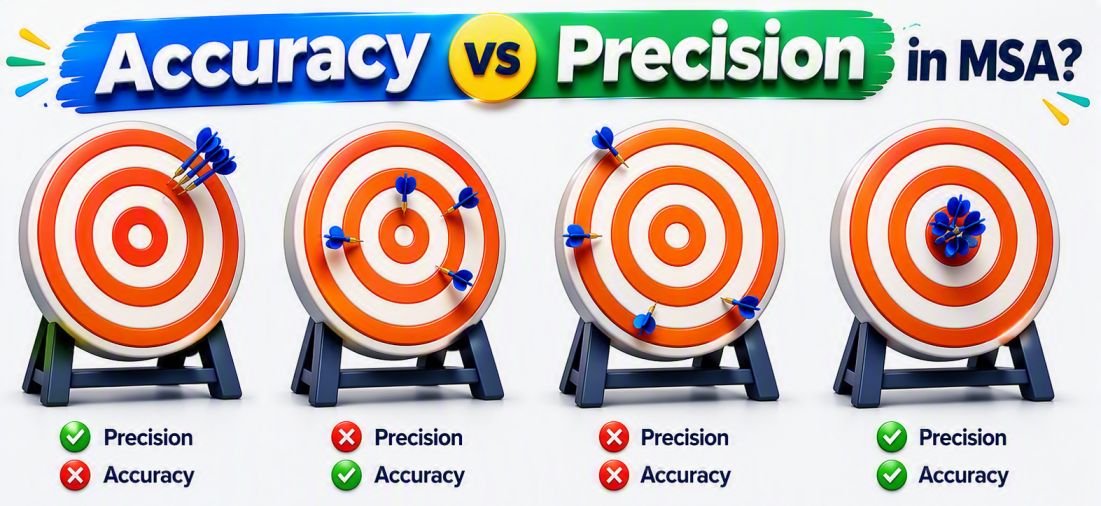
This is a good example of why consistency alone is not enough.
What is Gage R&R (Gage Repeatability and Reproducibility)?
Gage R&R (Repeatability and Reproducibility) is a widely used part of Measurement System Analysis (MSA) for understanding how much variation comes from the measurement process itself. In simple terms, it helps determine whether differences in measurement results are mainly coming from the parts being measured or from how those parts are measured.
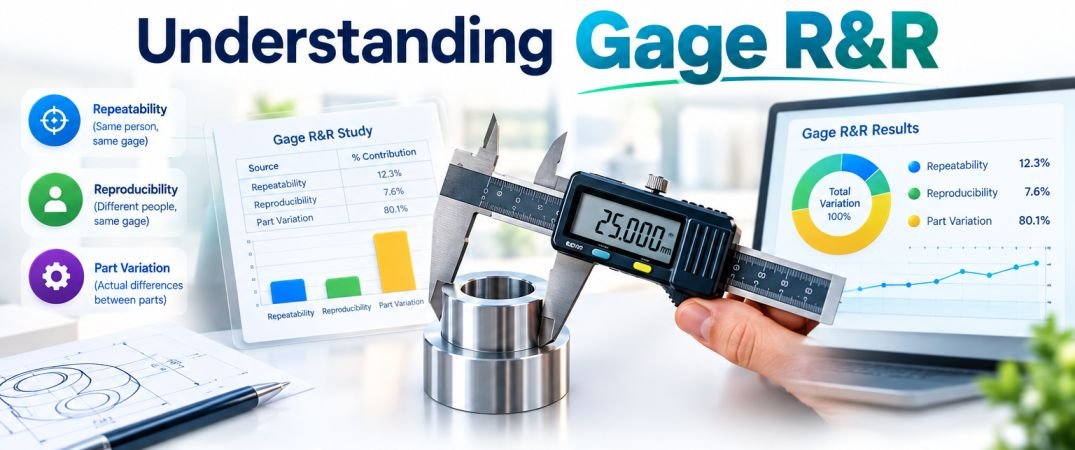
The concept is easier to understand with a practical example. Imagine several inspectors measuring the same dimensional feature using the same instrument. Some readings may differ slightly. The important question is whether that difference reflects real variation in the parts or variation introduced by the measurement process.
What Does Gage R&R Measure?
Gage R&R looks at two key sources of measurement variation.
Repeatability is the variation observed when the same operator measures the same part repeatedly using the same equipment and method.
It answers:
Can the same person get essentially the same result when measuring the same feature more than once?
Reproducibility is the variation observed when different operators measure the same part using the same equipment and method.
It answers:
Can different people obtain comparable results when measuring the same feature?
So, in simple terms:
Repeatability = variation within the same operator
Reproducibility = variation between operators
Together, these two sources form Gage R&R.
A Practical Example
Suppose three inspectors measure the diameter of the same group of components using the same digital caliper.
If one inspector gets noticeably different readings each time they measure the same part, the measurement process has a repeatability concern.
If each inspector’s readings are consistent individually, but the three inspectors consistently obtain different values from one another, the concern is reproducibility.
That distinction is useful because the investigation can then focus on the likely source rather than treating every measurement problem as an equipment issue.
From my own quality and design-assurance work, I’ve found that this is where Gage R&R becomes particularly practical. A statement such as “the measurements don’t look consistent” is difficult to act on. Breaking the variation into repeatability and reproducibility turns that concern into something that can be analyzed and discussed objectively.
Why Gage R&R Matters
Measurement variation can influence the conclusions drawn from quality data. If the measurement process contributes too much variation, a team may react to noise instead of a genuine change in the product or process.
Gage R&R helps quantify that measurement variation and provides evidence for judging whether the measurement process is suitable for its intended use.
One important point is often missed: Gage R&R is not synonymous with MSA. Gage R&R focuses specifically on repeatability and reproducibility, while MSA is the broader discipline used to evaluate measurement-system performance.
At its core, Gage R&R helps answer a very practical question:
When two measurements are different, how much of that difference is coming from the measurement process?
That question is central to making better use of measurement data and avoiding decisions based on variation that may not actually be present in the product or process.
📚 Recommended Books for Professionals
Try removing one or more filters.
What are the Different Types of MSA Studies?
Measurement System Analysis (MSA) is broader than Gage R&R. Different measurement situations call for different studies, depending on the type of data, measurement method, and question we need the measurement system to answer.
In practical quality work, one mistake I often see is treating every measurement problem as a Gage R&R problem. Gage R&R is important, but it is not the right tool for every situation. A dimensional measurement, a visual inspection, and a measurement that changes over time can require very different approaches.
The commonly used MSA studies include the following.
1. Gage R&R
Gage R&R (Repeatability and Reproducibility) is used primarily for variable measurements that produce numerical results.
It examines whether variation is coming from:
- Repeatability — differences when the same operator measures the same item repeatedly.
- Reproducibility — differences between operators measuring the same items.
Example: Several inspectors measure the diameter of components using the same micrometer.
2. Bias Study
A bias study looks at the difference between the measurement result and an accepted reference value.
It answers a simple question:
Is the measurement system consistently reading higher or lower than the reference?
For example, if a reference standard is 50.00 mm and repeated measurements consistently fall around 50.05 mm, the measurement system may have a systematic offset.
3. Linearity Study
A linearity study examines whether measurement bias remains reasonably consistent across the operating range of the measurement system.
A gage may perform well at one point in its range but show increasing or decreasing error as the measured value changes.
Example: An instrument may give acceptable results near 10 mm but show noticeably different bias near 100 mm.
4. Stability Study
A stability study evaluates whether measurement performance remains consistent over time.
Repeated measurements of a reference item are monitored at defined intervals to identify gradual shifts or changes in measurement performance.
This can be particularly useful when equipment is subject to wear, maintenance, environmental changes, or other time-dependent influences.
5. Attribute Agreement Analysis
Not every inspection produces a numerical measurement. In many applications, an inspector makes a judgment such as Pass/Fail, Accept/Reject, or Defect/No Defect.
An Attribute Agreement Analysis evaluates how consistently inspectors classify the same items and, where an accepted reference exists, how well their decisions agree with that reference.
For example, several inspectors might independently examine the same components for a visual defect. The analysis helps identify differences in inspection decisions that could otherwise be mistaken for actual product variation.
6. MSA for Destructive Measurements
Some testing methods cannot be repeated on the same specimen because the test changes or destroys the item.
Examples include tensile testing, burst testing, and certain destructive material tests. In these situations, conventional repeat-measurement approaches may not be appropriate, so the measurement process needs to be evaluated using an approach suited to the destructive nature of the test.
MSA Studies at a Glance
The right MSA study starts with the measurement problem, not the statistical method. In my view, that is one of the most important practical points: don't automatically reach for Gage R&R simply because it is the most familiar MSA tool. First understand what is being measured and what could make the result unreliable; then select the study that addresses that specific concern.
How to Calculate Gage R&R?
A Gage R&R study turns measurement variation into something that can be quantified and understood. The basic idea is simple: measure a representative group of parts with multiple operators, repeat the measurements, and use the results to estimate how much variation is coming from the measurement system.
A typical crossed study uses 10 parts, 3 operators, and 2 or 3 trials. These numbers are common for a standard study, but the actual design should fit the measurement process and its intended use.
For learning the fundamentals, the Average and Range (X̄–R) method is useful because the calculations are relatively transparent. In production, statistical software is often used to reduce arithmetic errors and make the analysis easier to review.
Step 1: Collect the Measurement Data
Each operator measures each selected part more than once using the same measurement method.
A simple study might look like this:
The quality of this raw data matters. Parts should represent the range of variation that the measurement system is expected to encounter, and the measurement procedure should remain consistent throughout the study.
Step 2: Calculate Repeatability
Repeatability, often called Equipment Variation (EV) in the Average and Range method, represents the variation when the same operator measures the same part repeatedly.
The basic relationship is:
where:
- EV = equipment variation
- R̄ = average of the measurement ranges
- K₁ = constant determined by the number of trials
A smaller EV indicates that repeated measurements under the same conditions are more consistent.
Step 3: Calculate Reproducibility
Reproducibility, commonly referred to as Appraiser Variation (AV), reflects differences between operators.
The exact calculation depends on the study design and the method used. In the traditional Average and Range approach, the operator-average difference is used together with the appropriate statistical constants.
The important idea is:
Repeatability looks within an operator; reproducibility looks between operators.
Step 4: Calculate Total Gage R&R
Once repeatability and reproducibility have been estimated, they are combined to obtain Gage R&R (GRR):
GRR therefore represents the combined measurement variation attributed to repeatability and reproducibility.
Step 5: Calculate Part-to-Part Variation
The study also needs to capture the variation between the parts being measured.
This is referred to as Part Variation (PV) in the traditional method and is estimated from the spread of the part averages:
where:
- PV = part-to-part variation
- Rₚ = range of the part averages
- K₃ = appropriate statistical constant
A study that includes parts with meaningful variation makes it easier to see whether the measurement system can distinguish one part from another.
Step 6: Calculate Total Variation
The overall variation is then estimated by combining the measurement-system variation with the part variation:
This gives the total variation represented in the study.
The relationship is:
Total Variation = Measurement-System Variation + Part-to-Part Variation
and:
Measurement-System Variation = Repeatability + Reproducibility
Step 7: Calculate %Gage R&R
A commonly reported metric is the percentage of total study variation attributable to Gage R&R:
This percentage provides a useful indication of how much of the observed variation is associated with the measurement system.
A Simple Worked Example
Suppose a study produces these values:
First, calculate Gage R&R:
Next, calculate total variation:
Finally:
So, in this illustrative example, the measurement-system contribution to total study variation is approximately 24.2%.
One practical point is worth emphasizing: the calculation is only as good as the study behind it. Poor part selection, inconsistent measurement technique, inadequate trials, or an unsuitable study design can produce a number that looks precise but does not tell you much about the real measurement process.
In my quality work, I find it more useful to treat the Gage R&R percentage as a starting point for understanding the measurement system, rather than as a number to chase in isolation. The value of the study comes from understanding where the variation originates and whether the measurement process is appropriate for the decision it needs to support.
MSA Acceptance Criteria (%GRR Guidelines)
Completing a Gage R&R calculation gives you a number. The more useful question is what that number means for the measurement system you are actually using.
A commonly used guideline in the AIAG Measurement Systems Analysis (MSA) Reference Manual evaluates Total Gage R&R as a percentage of study variation. AIAG continues to publish the fourth edition of its MSA reference manual, and Minitab's current guidance summarizes the commonly used AIAG interpretation as follows.
What Does %GRR Tell You?
%GRR indicates how much of the observed study variation is associated with the measurement system. A lower value generally means that the measurement process contributes less variation relative to the total variation being evaluated.
A result below 10% is generally viewed as a strong outcome. Between 10% and 30%, the measurement system falls into a gray area where the application and consequences of measurement error matter. Above 30%, the measurement system is generally considered inadequate for the intended use and should be investigated.
%GRR Less Than 10%
A %GRR below 10% generally indicates that measurement-system variation is relatively small compared with the variation represented in the study.
For example, a result of 7% would typically be interpreted as acceptable under the commonly used AIAG guideline.
That does not mean the measurement system is automatically perfect. The study still needs to make sense for the application, but the result is generally reassuring.
%GRR Between 10% and 30%
This is where engineering judgment becomes important.
A 22% GRR, for example, should not automatically be labeled either “good” or “bad.” According to the AIAG-based guidance, acceptability can depend on the application, cost of improving the measurement system, and other relevant factors.
For a low-risk application, that level of measurement variation may be workable. For a highly critical characteristic, the same result may not provide enough confidence.
From practical quality work, I have found that this is where people can become too focused on achieving a particular percentage. The better question is:
Is this measurement system good enough for the decision it needs to support?
%GRR Greater Than 30%
When %GRR is above 30%, the measurement system is generally considered unacceptable under the commonly cited AIAG guideline. Improvement should be considered before relying on the measurement results for important decisions.
The next step is not simply to repeat the study and hope for a lower number. The result should prompt an investigation into the measurement process and the factors contributing to its variation.
Don't Treat 10% and 30% as Magic Numbers
One practical point is worth emphasizing: 10% and 30% are guidelines, not universal pass/fail limits for every possible application.
The appropriate decision depends on factors such as the purpose of the measurement, the risk of an incorrect decision, customer or regulatory requirements, the tolerance involved, and the cost and feasibility of improving the system. AIAG-based guidance explicitly allows application-specific judgment in the 10%–30% range.
This is especially important in industries where measurement results support high-consequence decisions. A number that may be tolerable for one application may be unacceptable for another.
%Study Var and %Contribution Are Different
When reviewing MSA software output, make sure you know which percentage you are interpreting.
%Study Var compares the study variation attributed to a source with the total study variation. Minitab describes this measure using the study variation based on six standard deviations of the relevant component.
%Contribution is based on variance components instead. Because variance is squared, the two measures are not numerically equivalent.
For the corresponding AIAG-style variance-component interpretation, the commonly cited ranges are approximately:
The key is to match the acceptance guideline to the metric actually shown in the report rather than applying the 10%/30% rule to a different percentage.
Look Beyond the Final %GRR
A single percentage should not tell the entire MSA story. It is useful to understand whether the measurement variation is being driven primarily by repeatability or reproducibility, and whether the study contains enough meaningful part-to-part variation to distinguish the parts effectively. Minitab's interpretation guidance also recommends examining the components of variation rather than relying on the final percentage alone.
From my perspective, the best Gage R&R conclusion is not simply “GRR = 8%, therefore pass.” A stronger conclusion explains what the result says about the measurement system and whether that performance is appropriate for its intended use.
Use %GRR as a decision aid—not as a number to chase.
Ultimately, the purpose of MSA is to establish enough confidence in the measurement process that the data can support sound quality decisions. AIAG describes its MSA guidance in exactly this broader context: improving the quality of measurement data provides a stronger basis for better decisions and improvement.
How to Interpret Gage R&R Results
The overall %Gage R&R (%GRR) is usually the first result people check. It gives an indication of how much of the study variation is associated with the measurement system. But a good interpretation does not stop there. The underlying sources of variation matter just as much.
Start With %Gage R&R
For example, a 6% GRR would generally be considered a good result, while 35% would warrant investigation.
The 10%–30% range deserves judgment rather than an automatic pass or fail. A measurement system used for a low-risk application may be adequate at 20%, while the same result could be unacceptable for a critical characteristic where an incorrect measurement could lead to a significant decision.
The overall GRR tells you how much measurement variation exists. Repeatability and reproducibility help explain where that variation is coming from.
Repeatability reflects variation when the same operator measures the same part repeatedly.
Reproducibility reflects differences between operators measuring the same parts.
For example, if repeatability is much higher than reproducibility, it makes sense to look more closely at the equipment, setup, fixture, or measurement technique.
If reproducibility is the larger contributor, differences in operator technique, training, instructions, or interpretation may deserve attention.
This is where I find Gage R&R particularly useful in real quality work. I don't look at the final percentage first and then stop. The pattern of the results often gives a much better clue about what needs to be improved.
Check Part-to-Part Variation
The study should also tell you how much variation exists between the parts being measured.
A useful measurement system should be able to distinguish meaningful differences between parts. If the parts differ substantially but the measurement system contributes relatively little variation, the data becomes much more useful for understanding the process.
The Number of Distinct Categories (NDC) is another helpful result. It indicates how effectively the measurement system can differentiate between levels of observed part variation. A higher NDC generally means better discrimination.
Common Measurement Errors and How to Prevent Them
Measurement problems are not always caused by faulty equipment. In practice, small inconsistencies in the way a measurement is performed can be just as important as the instrument itself. A reading can look perfectly reasonable and still be wrong enough to influence a quality decision.
From my experience in quality and design assurance, I have found that many measurement issues come down to a few recurring causes: equipment condition, operator technique, measurement method, environmental conditions, and data handling.
MSA Gage R&R Calculator
Use this free MSA Gage R&R Calculator to quickly assess measurement system performance using Equipment Variation (EV), Appraiser Variation (AV), and Part Variation (PV). The calculator automatically computes Total Gage R&R, Total Variation, %GRR, % Contribution, and NDC, helping you determine whether your measurement system is suitable for making quality decisions. It is ideal for Lean Six Sigma, Quality Engineering, and Measurement System Analysis studies. Reliable measurement data forms the foundation for many quality improvement initiatives, including Failure Mode and Effects Analysis (FMEA), Root Cause Analysis (RCA), Six Sigma DMAIC projects, and Cost of Poor Quality (COPQ) reduction efforts. By understanding how much variation comes from the measurement system itself, organizations can make more confident quality decisions and focus improvement efforts where they will have the greatest impact.
Calculate Total Gage R&R, Total Variation, %GRR, % Contribution, and Number of Distinct Categories.
Frequently Asked Questions (FAQs)
Q. What does MSA stand for?
MSA stands for Measurement System Analysis, a method used to evaluate whether measurement data is reliable for its intended use.
Q. What is MSA in Six Sigma?
MSA is used in Six Sigma to verify that measurement data is trustworthy before analyzing or improving a process.
Q. What is Gage R&R?
Gage R&R stands for Gage Repeatability and Reproducibility and evaluates variation from measurement equipment and operators.
Q. Is Gage R&R the same as MSA?
No. Gage R&R is one type of MSA study, while MSA covers the broader evaluation of measurement-system performance.
Q. What is repeatability in MSA?
Repeatability is the variation when the same operator measures the same part repeatedly using the same equipment and method.
Q. What is reproducibility in MSA?
Reproducibility is the variation between different operators measuring the same part using the same measurement system.
Q. What is an acceptable Gage R&R?
A %GRR below 10% is commonly considered acceptable, while 10–30% may be acceptable depending on the application.
Q. What does %GRR mean?
%GRR indicates the proportion of study variation associated with the measurement system.
Q. Can a calibrated instrument fail Gage R&R?
Yes. Calibration alone does not ensure good measurement-system performance because other factors can introduce variation.
Q. How many parts are needed for Gage R&R?
A common study uses 10 parts, 3 operators, and 2–3 trials, although the design should suit the application.
Q. What is bias in MSA?
Bias is the difference between an observed measurement and an accepted reference value.
Q. What is linearity in MSA?
Linearity evaluates whether measurement bias remains consistent across the measurement system’s operating range.
Q. What is stability in MSA?
Stability evaluates whether measurement performance remains consistent over time.
Q. What is NDC in Gage R&R?
NDC (Number of Distinct Categories) indicates how effectively a measurement system can distinguish different levels of part-to-part variation.
Q. Why is MSA important?
MSA helps ensure that quality decisions are based on reliable measurement data rather than variation introduced by the measurement system.
Conclusion
Measurement System Analysis (MSA) helps ensure that measurement data is reliable enough to support quality decisions. A strong measurement system reduces the risk of confusing measurement variation with actual product or process variation.
From my experience in quality and design assurance, MSA is most valuable when it helps teams trust the data before acting on it.
Good decisions start with measurements you can trust.

Lean Six Sigma • Six Sigma • Statistics • Project Management • Artificial Intelligence (AI) • Operations Management • Quality Management
Continue Your Learning Journey
Learning is a continuous process. Explore related topics, practical guides, tools, calculators, templates, and learning resources to expand your knowledge and develop new skills.
Choose a category below to explore practical tutorials, tools, calculators, templates, case studies, and learning resources.
Recommended Learning Resources
Expert-led courses to build practical skills, earn credentials, and advance your career.
Recommended professional books, certification guides, and practical study resources.
Ready-to-use templates, checklists, guides, and workbooks for practical applications.
Interactive calculators for statistics, quality, engineering, analysis, and decision-making.
Interactive Z, t, Chi-Square, and F tables with critical values and distribution curves.
Discover practical tutorials, case studies, and professional resources across Quality, Lean Six Sigma, Project Management, Statistics, AI, and Data Analytics.
Published: September 18, 2026
Last Updated: September 18, 2026