
Introduction to Confidence Intervals
Confidence intervals (CIs) are fundamental in statistics, providing a range within which we expect a population parameter to fall. Understanding CIs is crucial for making informed decisions based on sample data. This guide will walk you through the basics, calculations, interpretations, and applications of confidence intervals.
What is a Confidence Interval in Statistics ?
A confidence interval is a range of values, derived from a sample, that is likely to contain the true population parameter. Instead of providing a single estimated value, confidence intervals offer an estimate with an associated level of certainty.
Key Components of Confidence Intervals:
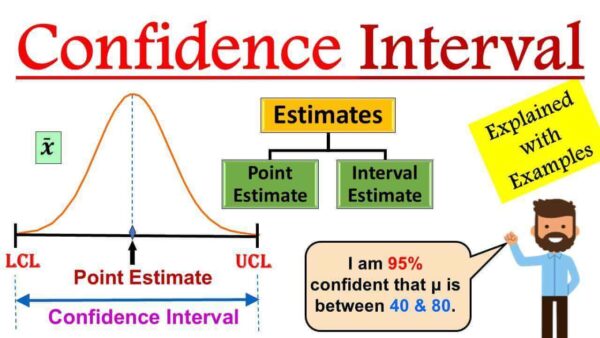
- Point Estimate: The best single estimate of the population parameter (e.g., sample mean or proportion).
- Margin of Error (MOE): The range added and subtracted from the point estimate.
- Confidence Level: The probability that the confidence interval contains the true population parameter (commonly 90%, 95%, or 99%).
- Standard Error: A measure of variability in the sample estimate.

Click here to Buy from Amazon
Before we understand the confidence Interval, let us first understand what do we mean by “Estimate“. Everyone makes some kinds of estimates at some point of time in their life. Imagine that you are crossing the road, and you see the car that is approaching you fast and now you can estimate the speed of that same car that is approaching you. Based on this estimate you can make your decision if you to wait, walk or run. This is called Estimate.
Now let’s define the Estimate in statistical terms. Estimate is a specific observed numerical value used to estimate an unknown population parameter or gives you some facts about how the population could be. We can have two types of estimates about the population.
Point Estimate and Interval Estimate :
Point Estimate
Suppose we have some population and we take a sample from this population and measure their weights estimate mean.
Average weight is 60 Kg. Then 60 kgs of sample mean is a Point estimate of a population mean.
Point estimate is often insufficient because its is either wrong or right. Assuming that we know its is wrong, but you don’t know how wrong it it. And you cannot be certain of estimate reliability. Assuming we came of know that you are off target by 5 kg, then you would expect 60k as good estimate but if the estimate is off by 30kg then it is not the right estimate of population.
Also the point estimate is going to be different from the population parameter because due to the sampling error, and there is no way to know who close it is to the actual parameter. For this reason, statisticians like to give an interval estimate which is a range of values used to estimate the parameter.
Interval Estimate
Because a point estimates is a single value, we can’t really tell how good it represents the population. So in inferential statistics, we prefer to use an interval or a range of values to estimate the population parameter. It gives you the range of values by calculating two different numbers between which we can expect the parameter to lie. So we construct Interval estimate with degree of certain degree of confidence say for e.g. 95% confidence.
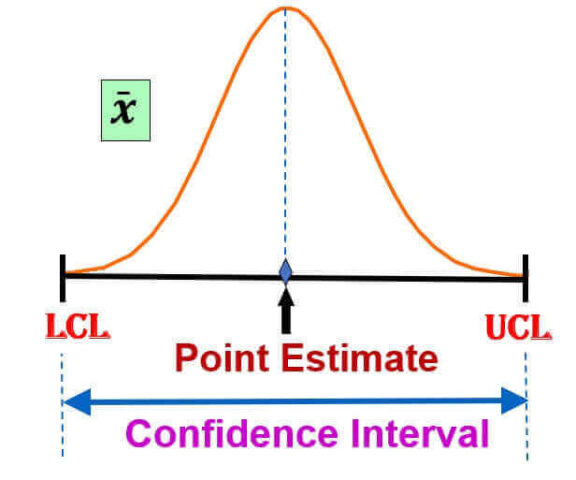
Confidence Interval
Confidence interval is the range of estimate we are making.
Don’t confuse confidence interval with confidence levels. Confidence levels are normally expressed as % ( For e.g. 95 % confidence level). A confidence interval communicates how accurate our estimate is likely to be. We use a confidence interval to express the range in which we are pretty sure the population parameter lies. These confidence Interval give us an idea about the size and thus the power of a study.
The size of the confidence interval is then directly related to the size of the study. The more participants the smaller the confidence interval and the more precise the estimated effect. In essence, the confidence interval estimate for a population mean lies between the sample mean – the margin of Error and the sample mean + the margin of Error.
The margin of error is calculated based on a confidence level. The confidence level basically refers to the percent of confidence intervals (from many samples) that we expect to contain the true population parameter.
Interpreting Confidence Intervals
A wider CI suggests more uncertainty, while a narrower CI suggests greater precision.
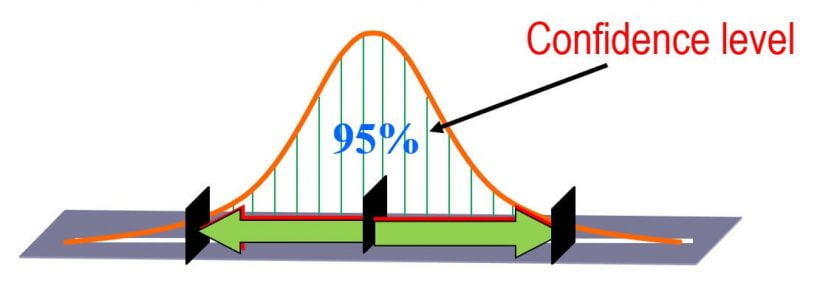
A 95% CI means that if we took many samples and computed the interval each time, about 95% of those intervals would contain the true population parameter.
Confidence levels of 90%, 95%, and 99% are often used, but 95% is the most commonly used confidence level. Most of times confidence intervals can be found using the t-distribution (When you are working with smaller number of samples.
Say for e.g we are 95 % confident that True mean will lie between 40 and 60. It indicates the error in two ways one by the extent of its range and other by probability of true population parameter lying within the range. Interval Estimates of population parameters are often called Confidence Intervals.
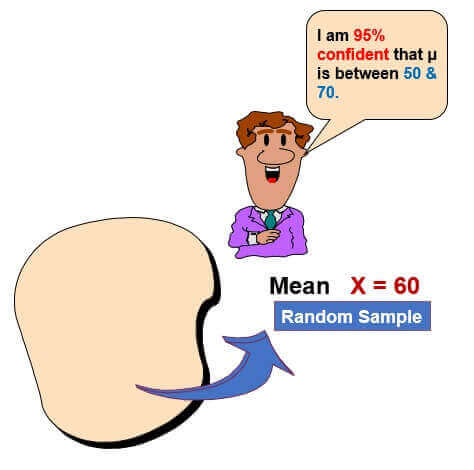
So 95% confidence interval is a range of values that you can be 95% certain contains the true mean of the population. The correct interpretation of a 95% confidence interval is that “we are 95% confident that the population parameter is between 50 and 70.”
Inference is when we draw conclusions about the population from the sample. Because the sample was only a selection of objects from the population, it will never be a perfect representation of the population.
Confidence Interval is the most common type of interval estimate is made of two elements :
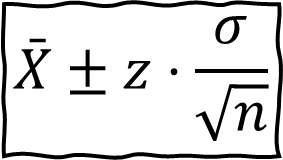
Confidence Interval = “Point estimate” +/- “Margin of Error”
Where Margin of errors are the upper and Lower limits of confidence Interval.
Now we can think let’s choose high confidence level say for e.g. 99% in all your estimation. But in practice, high confidence levels will produce large confidence intervals and they will end up giving very different estimates. Statisticians prefer interval estimate over point estimate because interval estimate are often accompanied with degree of confidence.
——————————————————————————————————————————————————-
How to Calculate a Confidence Interval
To compute a confidence interval, follow these steps:
Step 1: Identify the Sample Data
Determine the sample mean (μ), standard deviation (s), and sample size (n).
Step 2: Select the Confidence Level
Common confidence levels are:
- 90% (z = 1.645)
- 95% (z = 1.96)
- 99% (z = 2.576)
Step 3: Calculate the Standard Error (SE)
SE = s / √n (for mean) SE = sqrt[(p(1 – p)) / n] (for proportion)
Step 4: Compute the Margin of Error (MOE)
MOE = z * SE
Step 5: Determine the Confidence Interval
CI = Point Estimate ± MOE
Let’s understand this with some Scenarios:
Scenario #1
John : Will I get my Television within 1 year ?
Manager : I am absolutely certain that you will get in 1 year
Confidence level : Better than 99%
Confidence Interval : Would be 1 year
Scenario #2
John : Will I get my Television within 1 month ?
Manager : I am absolutely positive that you will get in 1 month
Confidence level : Better than 95%
Confidence Interval : Would be 1 month
Scenario #3
John : Will I get my Television within 1 week ?
Manager : I am positive that you will get in 1 week
Confidence level : Better than 80%
Confidence Interval : Would be 1 week
Scenario #4
John : Will I get my Television within 1 day ?
Manager : I can try that you will get in 1 day
Confidence level : Better than 30%
Confidence Interval : Would be 1 day
Scenario #5
John : Will I get my Television within 1 Hour ?
Manager : I can try but highly unlikely that you will get in 1 hour
Confidence level : Better than 5 %
Confidence Interval : Would be 1 hour
——————————————————————————————————————————————————-
Let’s understand this with some examples:
Example 1 : CI for Single population Mean
A random sample of n = 50 males showed a mean average daily intake of dairy products equal to 756 grams with a standard deviation of 35 grams. Find a 95% and 99% confidence interval for the population average U ?
Ans: x ̄ = 756 grams ; n= 50 , σ = 35 ,
The Z-value can be derived from the table and its shows us which area is contained in the confidence interval of our result so in case of the 95% confidence interval we take although use between minus 1.96 times and plus 1.96 times the standard deviation. A lower confidence interval will lead to a lower Z-value and a smaller interval and vice versa
From Z table for 95 % confidence interval we get value as 1.96.
=> Interval estimate is = 756±1.96×35/√50
=> 746.30 ≤ m ≤ 765.70 grams for 95 % confidence interval
Now for 99 % confidence interval and From Z table for 99 % CI we get value as 2.576
=> 756±2.576×35/√50
=> 743.23 ≤m≤ 768.77 grams for 99 % confidence interval.
——————————————————————————————————————————————————-
Example 2 : CI for Single population Proportion
Billing statement for 1000 patients discharged from a particular hospital were randomly selected for error. Out of 1000 billing statements, 102 were found to contain errors. Using this formation lets construct 99% confidence interval ?
Ans: p ̂ = 102 / 1000 = 0.102
From Z table for 99 % confidence interval we get value as 2.576


p ̂ = is random and varies from sample to sample
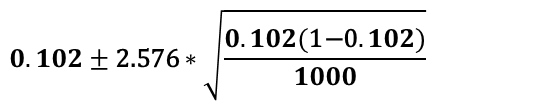
0.077 ≤p ̂≤0.127for 99 % confidence interval
——————————————————————————————————————————————————-
Watch this YouTube video for detailed explanation :
What does 95% confidence interval mean ?
95% CI means that there’s a 95% chance that the true mean is within the range. Larger sample size will result in a narrower confidence interval.
Conclusion
Confidence intervals are a vital statistical tool for estimating population parameters with a degree of certainty. By understanding their calculation, interpretation, and application, you can make more informed decisions in various fields. Mastering CIs enhances analytical skills and aids in making data-driven conclusions.
For questions please leave them in the comment box below and I’ll do my best to get back to those in a timely fashion. And remember to subscribe to Digital eLearning YouTube channel to have our latest videos sent to you while you sleep.
I hope this blog helped in understanding the basic concept in a simplified manner, watch out for more such stuff in the future.
📢📢 𝑺𝒐𝒄𝒊𝒂𝒍 𝑴𝒆𝒅𝒊𝒂 𝑳𝒊𝒏𝒌:
Thanks!!!
For questions please leave them in the comment box below and I’ll do my best to get back to those in a timely fashion. And remember to subscribe to Digital eLearning YouTube channel to have our latest videos sent to you while you sleep.
✍️ 𝓓𝓲𝓼𝓬𝓵𝓪𝓲𝓶𝓮𝓻: Copyright Disclaimer under section 107 of the Copyright Act of 1976, allowance is made for “fair use” for purposes such as criticism, comment, news reporting, teaching, scholarship, education and research. Fair use is a use permitted by copyright statute that might otherwise be infringing. The information contained in this video is just for educational and informational purposes only and does not have any intention to mislead or violate Google and YouTube community guidelines or policy. I respect and follow all terms & conditions of Google & YouTube.


