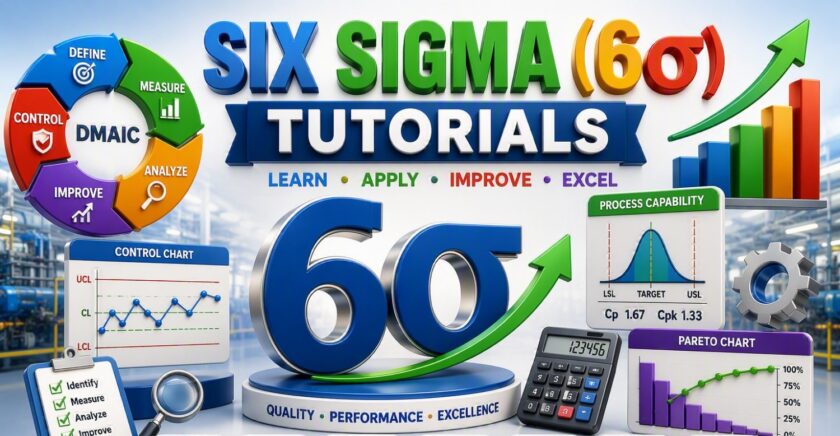
Six Sigma is a structured, data-driven methodology designed to reduce process variation, eliminate defects, improve quality, and enhance customer satisfaction. It is widely used by world-class organizations to solve recurring business problems and drive continuous improvement.
📌 Why Six Sigma Matter
Six Sigma is a proven methodology for reducing defects, improving quality, minimizing variation, and increasing customer satisfaction. Organizations use Six Sigma principles to solve problems, improve processes, and make more data-driven decisions. Six Sigma combines data-driven decision making, problem-solving, and process improvement techniques to help organizations reduce variation, improve quality, and deliver more consistent results.
To complement the written content, detailed video explanations are also available on the “Digital E-Learning” YouTube channel, providing additional clarity and practical insights
🎯 Who Should Learn Six Sigma?
- Quality Professionals
- Engineers
- Manufacturing Professionals
- Continuous Improvement Teams
- Project Managers
- Students and Job Seekers
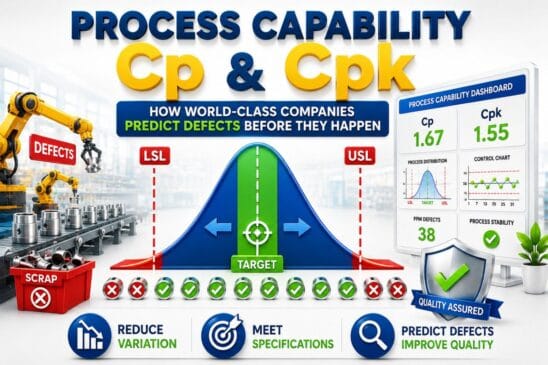
Process Capability (Cp & Cpk)? Predict Defects Before They Happen

What is Six Sigma (6σ)? How World-Class Companies Improve Quality and Save Millions

Central Limit Theorem (CLT): The Foundation of Modern Statistics Behind Six Sigma, Quality Engineering & Data Analysis
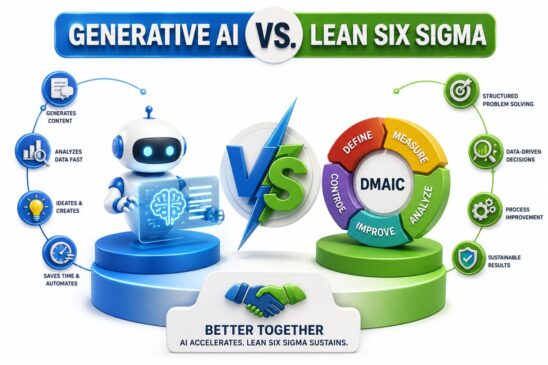
Can Generative AI Replace Lean Six Sigma in the Future?
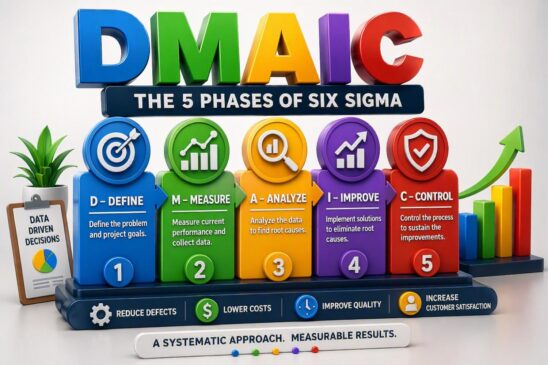
DMAIC Master Guide: Complete Six Sigma Framework
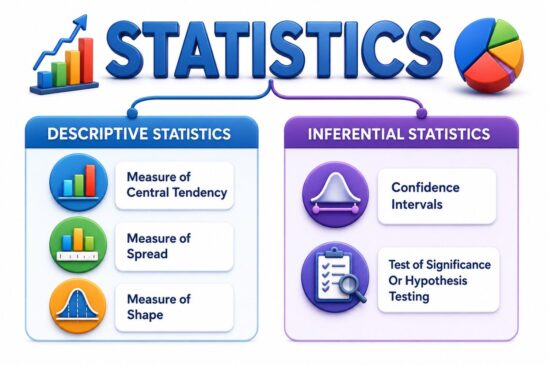
Statistics is more than Math: Why most people Learn Statistics Wrong