What is Value Stream Mapping : A Practical Guide to Current State, Future State and Process Improvement
Value Stream Mapping (VSM) is a powerful Lean tool used to visualize the flow of materials, information, and activities required to deliver a product or service. It helps organizations identify waste, uncover bottlenecks, and understand how value is created across a process.
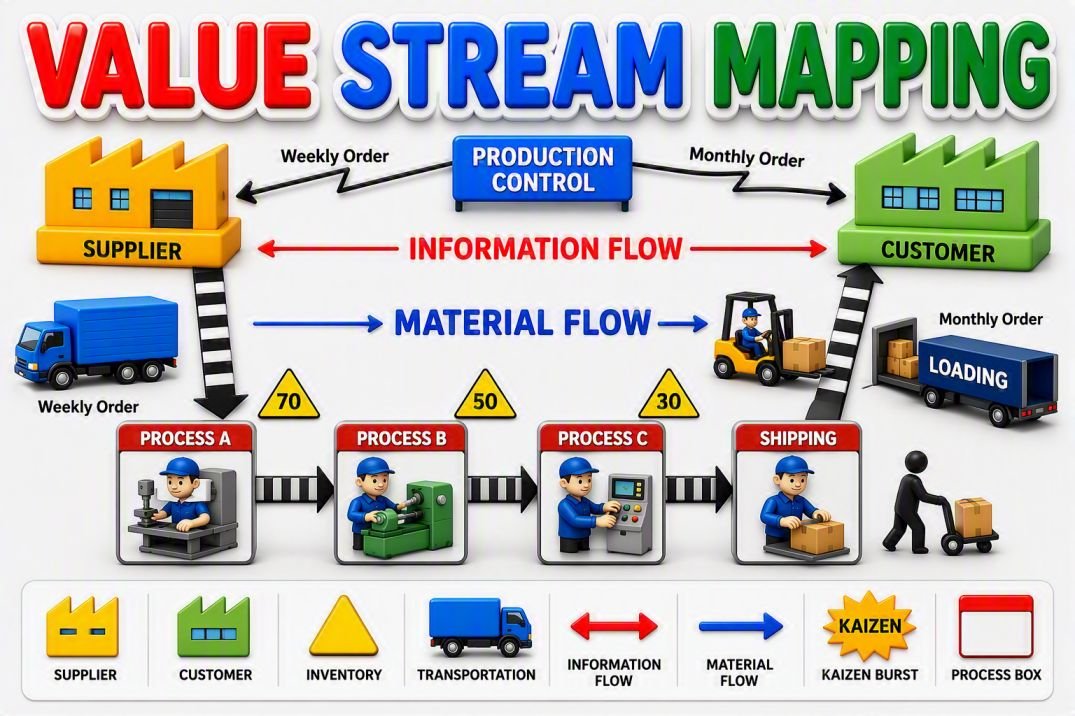
By mapping both the current state and the future state, teams can develop targeted improvement actions that reduce lead time, improve flow, increase efficiency, and enhance customer value. Today, VSM is widely used in manufacturing, healthcare, supply chains, service industries, and continuous improvement initiatives to drive operational excellence.
What is Value Stream Mapping?
The first time I created a Value Stream Map, I expected to find a few obvious inefficiencies. Instead, I discovered that most of our lead time wasn’t spent making the product at all. It was hidden in waiting, queues, handoffs, and unnecessary inventory. That experience taught me why Value Stream Mapping (VSM) remains one of the most powerful Lean tools available. Simply put, Value Stream Mapping is a visual method for understanding how work flows from start to finish and identifying what slows that flow down. Rather than focusing on a single process step, it looks at the entire journey, helping teams see where value is created and where time, effort, and resources are being wasted.
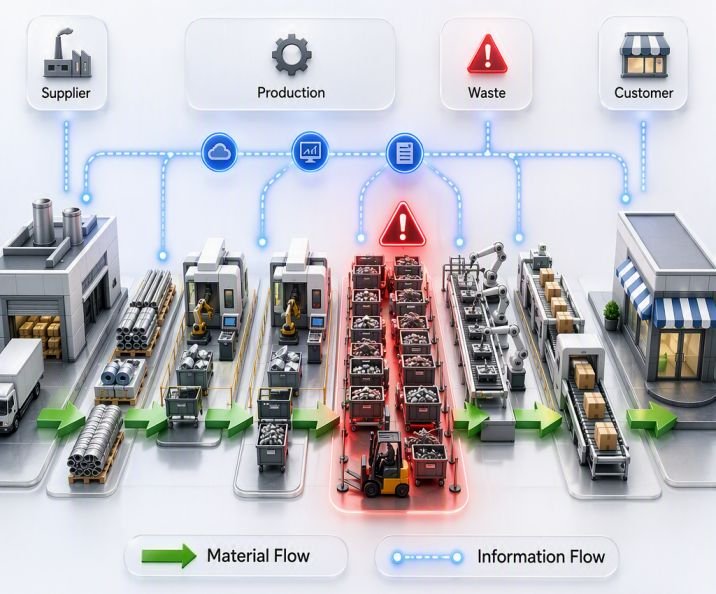
What makes VSM different is that it combines material flow, information flow, and performance data on a single map. This creates a clear picture of how work actually happens, not how it is supposed to happen.
In manufacturing, a Value Stream Map might follow a product from raw material receipt to shipment. In healthcare, it could track a patient journey. In an office environment, it may visualize how a request moves through approvals before reaching a customer. Regardless of the industry, the objective remains the same:
Make value flow faster by removing waste and reducing delays.
A well-built Value Stream Map helps answer important questions:
- Where are the bottlenecks?
- How much of the lead time actually adds value?
- Which activities create delays or rework?
- Where is inventory or work accumulating?
- What should the future state process look like?
For Lean practitioners, engineers, and continuous improvement teams, VSM is more than a mapping exercise. It is a decision-making tool that turns assumptions into facts and highlights opportunities that are often hidden in day-to-day operations.
The best Value Stream Maps do not just document the current process. They reveal a clear path from the current state to a future state with less waste, shorter lead times, and better flow. That is where the real power of Value Stream Mapping lies.
Why Value Stream Mapping Matters in Lean Manufacturing?
One lesson I’ve learned from improvement projects is that the biggest problems are rarely where people expect them to be. Teams often focus on making a machine faster or improving a specific operation, while the real delays sit quietly between processes in the form of waiting, excess inventory, approvals, or poor information flow.
That’s why Value Stream Mapping is so important in Lean Manufacturing.
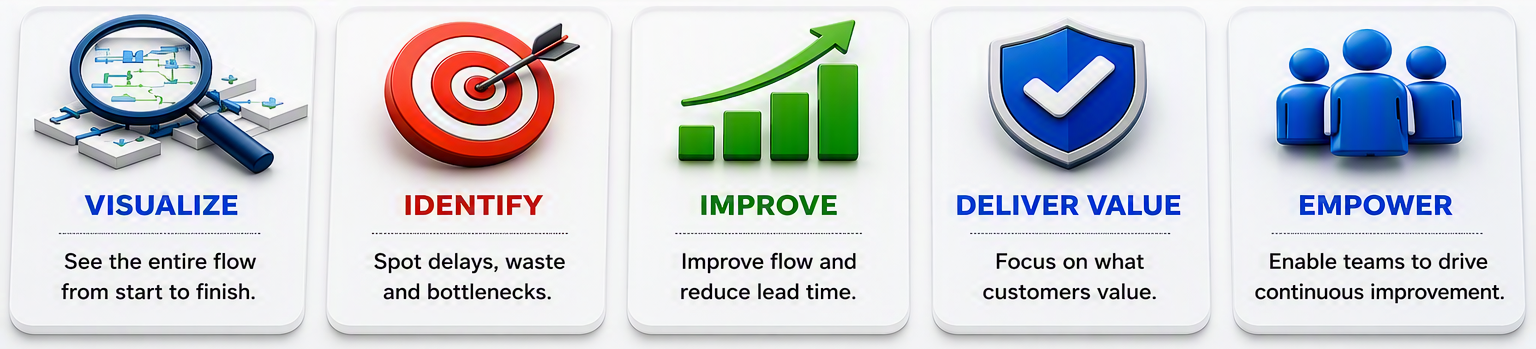
Rather than looking at individual activities, VSM helps you see the entire journey from raw material to customer delivery. When everything is visible on one page, waste becomes easier to spot, bottlenecks stand out, and improvement opportunities become much clearer.
In my experience, the most valuable insight from a Value Stream Map is not identifying a slow process. It’s discovering how much time is lost when no value is being created at all. I’ve seen processes where actual work took only a few hours, yet the total lead time stretched across weeks because products spent most of their time waiting in queues.
This is exactly what Lean Manufacturing aims to eliminate.
A well-built Value Stream Map helps organizations:
- Uncover hidden waste that often goes unnoticed
- Identify bottlenecks limiting flow and throughput
- Reduce lead time and work-in-process inventory
- Improve visibility across departments
- Prioritize improvements based on facts rather than assumptions
Most importantly, VSM creates a shared understanding of how the process really works. Instead of debating opinions, teams can focus on what the data and the map reveal.
For me, that’s the real value of Value Stream Mapping. It doesn’t just document a process. It exposes the gap between where you are today and where you could be tomorrow, making continuous improvement far more focused and effective.
🎓 Top-Rated Courses & Certifications
Try changing your filters or searching for another course.
Understanding Current State and Future State Maps
One of the most valuable lessons I’ve learned from Value Stream Mapping is that improvement starts with honesty. Before discussing solutions, you need a clear picture of how the process actually performs today. That’s the purpose of the Current State Map.
A Current State Map captures reality. It shows how materials and information flow through the process, including delays, bottlenecks, excess inventory, rework, and other inefficiencies. In many projects I’ve participated in, the map revealed that products spent far more time waiting than being worked on. Those hidden delays often become the biggest improvement opportunities.
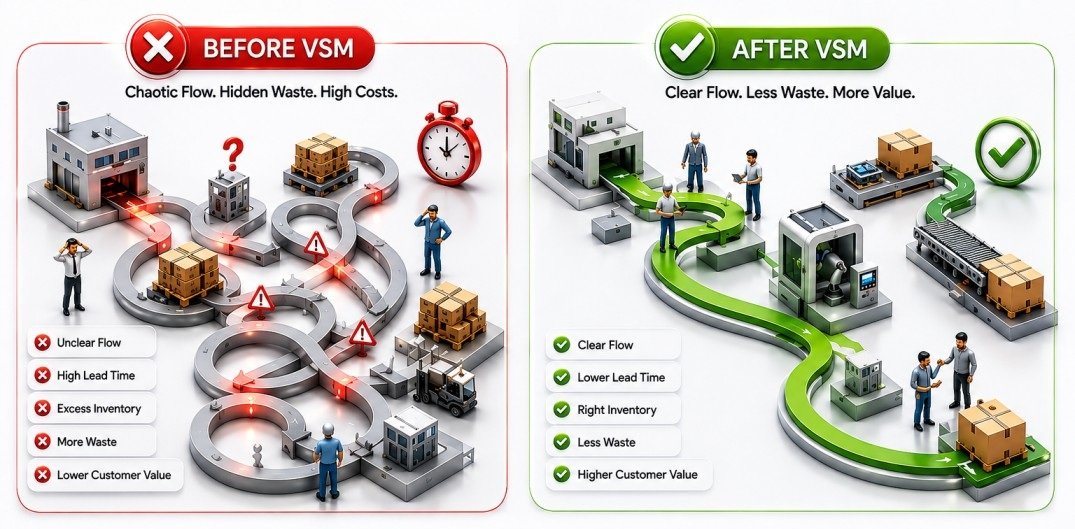
A Future State Map is different. It represents the process you want to create after removing waste and improving flow. Rather than documenting existing problems, it provides a practical vision of a faster, simpler, and more efficient system.
In simple terms:
- Current State = Where you are today
- Future State = Where you want to be
The real power of Value Stream Mapping comes from comparing these two views. The Current State exposes what’s holding performance back, while the Future State defines what better looks like.
A good Future State Map is not about building a perfect process on paper. It’s about designing realistic improvements that reduce lead time, eliminate unnecessary activities, improve flow, and better meet customer demand.
In my experience, the gap between the Current State and Future State becomes the improvement roadmap. It helps teams move beyond assumptions and focus on the changes that will deliver the greatest impact. That’s what makes Value Stream Mapping more than a drawing exercise. It’s a practical tool for turning insights into measurable results.
Value Stream Mapping vs. Process Mapping
I’ve used both Process Mapping and Value Stream Mapping on improvement projects, and the biggest difference comes down to perspective.
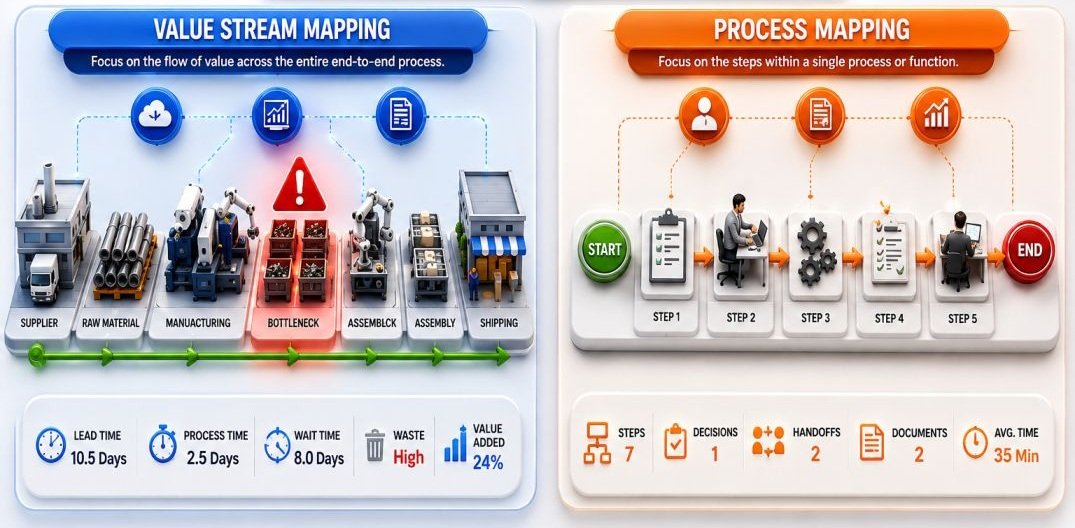
A Process Map helps you understand the steps within a process. It’s useful when you want to document how work is performed, train employees, or standardize a workflow.
A Value Stream Map goes beyond the steps. It shows how work flows across the entire system, including waiting time, inventory, information flow, and delays that often remain hidden in traditional process maps.
In practice, I’ve found that a process map can explain what happens, while a value stream map reveals why the process feels slow.
For example, a process map may show that an approval takes five minutes. A Value Stream Map often uncovers that the request sits in a queue for three days before anyone reviews it. That’s where the real improvement opportunities usually exist.
Key Differences
| Process Mapping | Value Stream Mapping |
|---|---|
| Focuses on individual workflow steps | Focuses on the end-to-end flow of value |
| Documents how work is performed | Identifies waste, delays, and bottlenecks |
| Useful for standardization | Useful for Lean improvement |
| Includes limited performance data | Includes lead time, inventory, and flow metrics |
| Provides a process-level view | Provides a system-level view |
Neither tool is better than the other. They simply serve different purposes. If your goal is to understand a specific workflow, a Process Map is often enough. If your goal is to reduce lead time, improve flow, and eliminate waste across the entire operation, Value Stream Mapping provides a much more powerful perspective.
In my experience, the most successful Lean projects use both. Process Mapping helps teams understand the details, while Value Stream Mapping helps them focus on improvements that deliver the greatest business impact.
The Two Maps: Current State vs. Future State
One of the biggest reasons Value Stream Mapping works so well is that it forces you to look at both reality and possibility.
The Current State Map shows how the process operates today, not how people think it operates. In my experience, this is where the real surprises appear. What seemed like a capacity issue often turned out to be waiting time, excess inventory, or poor information flow between teams.
The Future State Map is the next step. It takes those findings and turns them into a practical vision for a better process. The focus shifts from identifying problems to improving flow, reducing delays, and delivering value more efficiently.
Think of the two maps as a before-and-after picture:
- Current State: Where the process stands today
- Future State: Where the process should go next
Current State Map
The purpose of a Current State Map is to uncover what’s slowing performance down. It helps teams visualize:
- Bottlenecks
- Waiting time
- Excess inventory
- Rework and inefficiencies
- Information flow gaps
Future State Map
The Future State Map answers a different question:
If waste was removed, what would the process look like?
It focuses on:
- Better flow
- Shorter lead times
- Lower inventory
- Fewer handoffs
- Improved customer response
The real value isn’t in drawing either map. It’s in understanding the gap between them. That gap becomes the improvement plan.
From my experience, organizations achieve the best results when they stop treating Current and Future State Maps as documentation exercises and start using them as a roadmap for change. That’s when Value Stream Mapping moves beyond analysis and begins delivering measurable business results.
Key Value Stream Mapping Symbols and What They Mean
The first few Value Stream Maps I created looked more confusing than helpful. Not because the process was complex, but because I didn’t fully understand the symbols. Once I learned the basics, reading a Value Stream Map became much easier.
The good news is that you don’t need to memorize dozens of symbols. In practice, a handful of common symbols appear in most Value Stream Mapping exercises and provide enough information to understand how work, materials, and information move through the process.
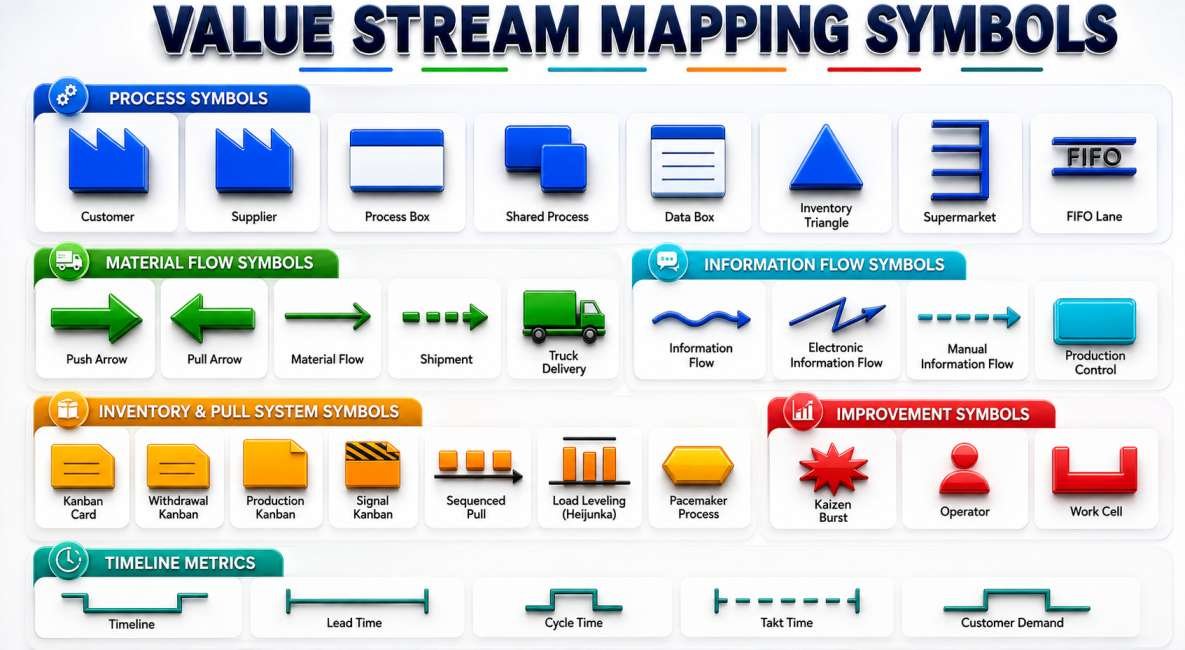
Process Box
The process box represents a step where work is performed or value is created. This could be machining, assembly, inspection, packaging, or any activity that transforms the product or service.
Example: CNC Machining, Final Assembly, Quality Inspection.
Data Box
Located beneath the process box, the data box contains key performance information used to analyze the process.
Typical data includes:
Cycle Time (CT)
Changeover Time (C/O)
Uptime
Number of Operators
Scrap Rate
These metrics often reveal improvement opportunities that aren’t obvious from the process flow alone.
Inventory Triangle
The inventory symbol indicates materials, components, or work-in-process waiting between operations.
From my experience, these triangles often tell an important story. Large inventory levels usually point to flow issues, bottlenecks, or scheduling challenges elsewhere in the process.
Material Flow Arrow
This arrow shows the physical movement of materials through the value stream.
It answers a simple question:
How does the product move from one process to the next?
Information Flow Arrow
While material flow shows product movement, information flow shows how instructions, schedules, or production orders move through the organization.
Many process delays originate from poor information flow rather than physical production constraints.
Supplier and Customer Symbols
These symbols define the boundaries of the value stream.
Supplier: Source of materials or information
Customer: Recipient of the finished product or service
Every Value Stream Map begins and ends with these two elements.
Timeline
The timeline appears at the bottom of the map and is one of the most valuable sections.
It separates:
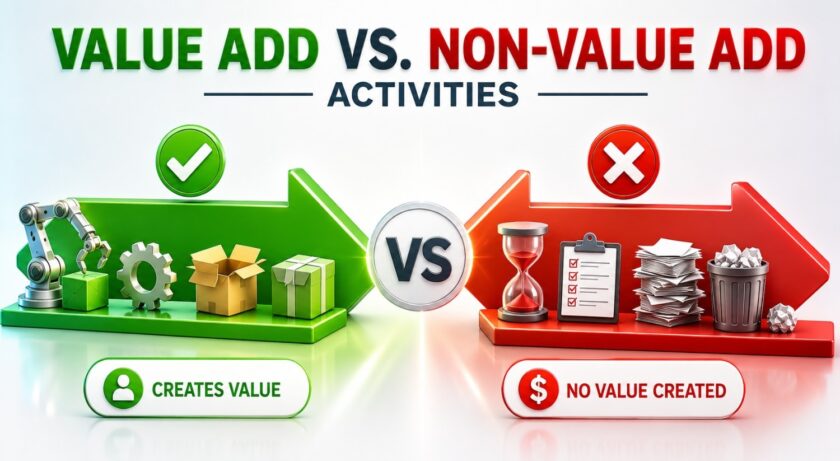
Value-Added Time (actual processing)
Lead Time (total elapsed time)
In many organizations, this comparison reveals that only a small portion of total lead time is spent creating customer value.
Why Symbols Matter
The symbols themselves are not the goal. Their purpose is to create a common language that helps teams visualize flow, identify waste, and make better improvement decisions.
In my experience, once teams understand these core symbols, conversations quickly shift from “What does this mean?” to “How do we improve it?” and that’s where the real value of Value Stream Mapping begins.
How to Create a Current-State Value Stream Map — Step by Step
When I create a Current-State Value Stream Map, I don’t start with software or symbols. I start by walking the process. Every successful VSM I’ve worked on was built from what was actually happening on the shop floor, not from assumptions made in a conference room.
Step 1: Define the Scope
Choose a specific product family or process to map. Trying to map everything at once usually creates confusion and hides the real issues.
Ask yourself:
Where does the process begin, and where does it end?
A clear scope keeps the map focused and actionable.
Step 2: Walk the Process
Go to where the work happens and follow the flow from start to finish. Observe how materials move, how decisions are made, and where work tends to accumulate.
This step often reveals more than any report or KPI dashboard.
Step 3: Identify the Major Process Steps
List the key activities required to deliver the product or service. Keep it simple and focus on the major process stages rather than every minor task.
Step 4: Collect Real Process Data
This is where the map becomes valuable.
For each process step, capture:
- Cycle Time (CT)
- Changeover Time (C/O)
- Uptime
- Number of Operators
- Scrap or Rework Rates
- Inventory Levels
Use actual data whenever possible. Estimates rarely lead to meaningful improvements.
Step 5: Map Material and Information Flow
Add arrows showing how materials move between processes and how information triggers the work.
Many delays originate from poor communication rather than production limitations, so both flows matter.
Step 6: Add Inventory and Waiting Points
Between processes, document inventory, queues, and work-in-progress. In my experience, these areas often contain the biggest opportunities for lead time reduction.
Step 7: Build the Timeline
At the bottom of the map, calculate:
- Value-Added Time
- Waiting Time
- Total Lead Time
This is usually the moment when teams realize how little of the total lead time is spent creating customer value.
Step 8: Highlight Improvement Opportunities
Before discussing solutions, mark areas where waste is visible:
- Bottlenecks
- Long waiting times
- Excess inventory
- Rework loops
- Information flow issues
The goal of the Current-State Map is not to fix the process. Its job is to reveal reality. From my experience, the most effective Value Stream Maps are surprisingly simple. They don’t try to impress people with detail. They make problems visible, which is the first step toward meaningful process improvement.

Lean Six Sigma • Six Sigma • Statistics • Project Management • Artificial Intelligence (AI) • Operations Management • Quality Management
How to Turn a Future-State Map into an Improvement Plan
Creating a Future-State Map is the easy part. Turning it into real results is where the work begins. I’ve seen teams build impressive future-state designs, only to revisit the same problems months later because no clear action plan existed. A Future-State Map should never be the final deliverable. It should be the starting point for improvement.
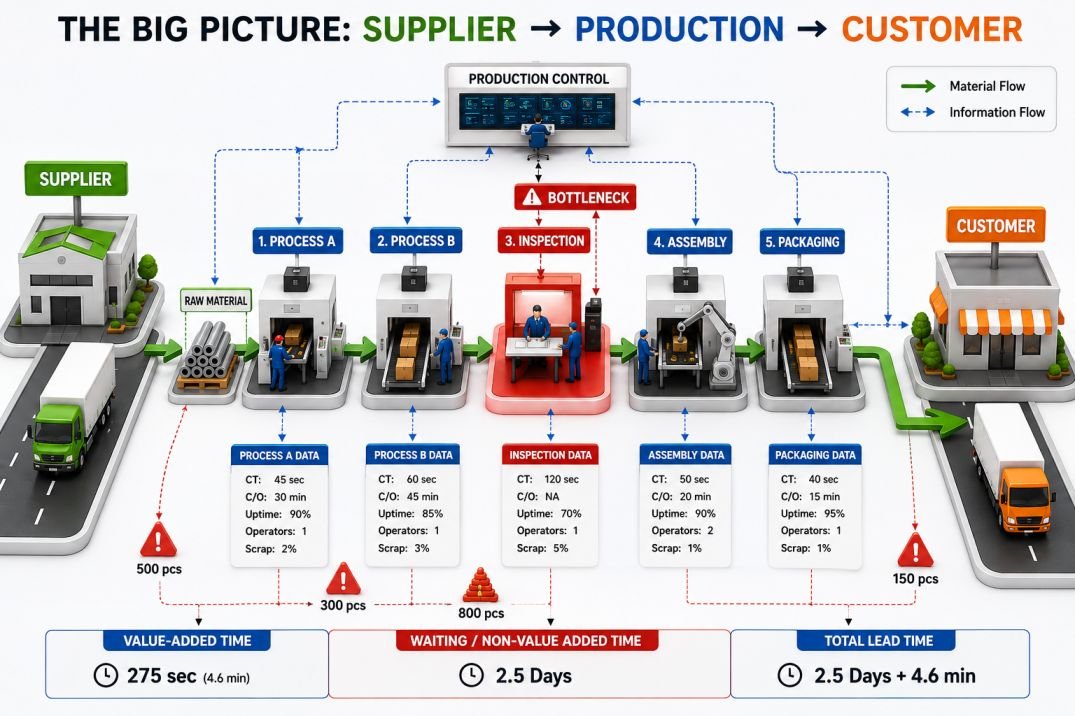
The first step is to focus on the biggest gaps between the current and future state. Not every issue deserves immediate attention. In most Lean projects I’ve worked on, a few targeted improvements created the majority of the impact.
Instead of asking, “How do we achieve the entire future state?” ask:
“What is the next improvement that will move us closer to it?”
Prioritize the Highest-Impact Changes
Look for opportunities that directly improve flow, such as:
Eliminating bottlenecks
Reducing waiting time
Lowering inventory levels
Simplifying handoffs
Improving information flow
These changes often deliver faster results than large-scale transformation projects.
Assign Ownership
Every improvement needs a clear owner. One of the most common reasons improvement initiatives stall is because everyone agrees on the solution, but nobody is responsible for making it happen.
For each action, define:
What will be changed
Who is responsible
When it will be completed
How success will be measured
Measure Progress
A Future-State Map should improve business performance, not just create a better-looking process.
Track metrics such as:
Lead Time
Cycle Time
Inventory Levels
On-Time Delivery
Process Cycle Efficiency (PCE)
If these measures are not improving, the plan may need adjustment.
Treat It as a Living Roadmap
The best Future-State Maps evolve over time. As improvements are implemented, new constraints emerge and priorities shift. That’s a normal part of continuous improvement.
In my experience, successful organizations don’t frame the Future-State Map and hang it on a wall. They use it as a working roadmap, reviewing progress regularly and continuously moving the process closer to the desired future state. That’s when Value Stream Mapping delivers lasting results rather than temporary improvements.
Real-World Value Stream Mapping Example
One of the most impactful Value Stream Mapping exercises I participated in wasn’t focused on improving machine speed or adding resources. The objective was simple: understand why orders were taking so long to reach customers.
When we mapped the current state, the results were surprising. The actual manufacturing work took only a few hours, but the overall lead time stretched across several days. Most of that time wasn’t spent creating value. Products were sitting in queues, waiting for inspection, waiting for the next operation, or waiting for someone to make a decision.
The Current-State Map quickly highlighted three major issues:
- Excess work-in-process inventory between operations
- Long waiting periods before inspection
- Uneven workload across departments
Instead of investing in new equipment, the team focused on improving flow. Inventory buffers were reduced, information flow was simplified, and scheduling practices were adjusted to better balance the workload.
The outcome was a shorter lead time, lower inventory levels, and improved delivery performance without increasing headcount or purchasing additional machinery. The biggest lesson from this project was that the bottleneck wasn’t where people thought it was. The process itself wasn’t slow. The flow between processes was.
That’s why I consider Value Stream Mapping one of the most valuable Lean tools available. It helps teams move beyond assumptions and uncover where time is truly being lost. Often, the greatest opportunity isn’t making people work faster. It’s removing the delays that prevent work from flowing smoothly in the first place.
📚 Recommended Books for Professionals
Try removing one or more filters.
Common Value Stream Mapping Mistakes
I've seen Value Stream Mapping deliver remarkable results, but I've also seen projects fail because teams made a few avoidable mistakes. Interestingly, the problem is rarely the map itself. It's how the mapping exercise is executed.
Mapping from a Conference Room
One of the most common mistakes is creating a map based on assumptions, reports, or someone's memory of the process. In my experience, the biggest discoveries happen on the shop floor, not in a meeting room. If you don't observe the work firsthand, there's a good chance you'll miss the real problem.
Using Estimates Instead of Real Data
A Value Stream Map should be built on facts. When cycle times, inventory levels, or lead times are estimated, improvement decisions become less reliable. I've found that even small measurement errors can point teams toward the wrong solution.
Focusing on Activities Instead of Flow
Many teams document every process step perfectly but overlook what happens between those steps. The largest delays are often found in queues, handoffs, approvals, and waiting time. That's where Value Stream Mapping creates the most value.
Trying to Map Everything at Once
A map that is too large quickly becomes difficult to understand and nearly impossible to improve. Start with one product family or value stream. Focus creates clarity.
Jumping Straight to Solutions
It's tempting to propose improvements before the Current-State Map is complete. I've made that mistake myself. The risk is solving a symptom while the actual constraint remains hidden elsewhere in the process.
Creating a Future State Without Follow-Through
A Future-State Map is only useful if it leads to action. Without clear ownership, priorities, and measurable goals, it becomes another document that looks impressive but changes nothing.
My Biggest Takeaway
The best Value Stream Maps are not the most detailed. They're the most honest. When teams focus on real observations, accurate data, and the flow of work rather than individual tasks, Value Stream Mapping becomes far more than a Lean exercise. It becomes a powerful tool for uncovering waste, reducing lead time, and driving meaningful process improvement.
Free Value Stream Mapping Calculator
This Value Stream Mapping (VSM) Calculator helps you analyze process flow efficiency and identify Lean improvement opportunities. Begin by entering your Customer Demand, Available Production Time, and the details for each process step, including Cycle Time, Value-Added Time, and Waiting Time.
- Enter Customer Demand – Specify the number of units required by customers each day.
- Enter Available Production Time – Input the total production time available per day.
- Add Process Steps – Enter each process, along with its Cycle Time, Value-Added Time, and Waiting Time. Use “+ Add Process” to add additional steps.
- Calculate VSM – Click “Calculate VSM” to generate the key metrics.
- Review the Results – The calculator provides Takt Time, Lead Time, Value-Added Time, Non-Value-Added Time, and Process Cycle Efficiency (PCE). I
- Identify Improvement Opportunities – Use the results to identify waiting, delays, and non-value-added activities that can be targeted for Lean improvement.
- Download Your Report – Click “Download VSM Report” to save a PDF summary of your analysis.
💡 Tip: For the most meaningful results, include all major process steps and waiting/inventory time between processes. This will help you get a better picture of the Current State Value Stream.
Value Stream Mapping Calculator
Build your process flow and calculate Takt Time, Lead Time, Value-Added Time and Process Cycle Efficiency.
📊 Customer & Production Information
Enter the basic information for your value stream.
🏭 Process Steps
Add every major process in your value stream.
📈 VSM Results
Download Your VSM Report
Download your complete Value Stream Mapping analysis including all process steps.
Frequently Asked Questions (FQAs)
Q. What is Value Stream Mapping (VSM)?
Value Stream Mapping is a Lean tool used to visualize the end-to-end flow of materials and information, helping teams identify waste, delays, and improvement opportunities.
Q. What is the main purpose of Value Stream Mapping?
The goal is to improve process flow by reducing waste, shortening lead times, and increasing value delivered to customers.
Q. What is the difference between a Current-State Map and a Future-State Map?
A Current-State Map shows how the process operates today, while a Future-State Map illustrates how the process should operate after improvements are implemented.
Q. Is Value Stream Mapping only used in manufacturing?
No. VSM is widely used in healthcare, logistics, software development, service industries, and administrative processes.
Q. What data should be collected before creating a Value Stream Map?
Typical data includes cycle time, lead time, inventory levels, changeover time, uptime, scrap rate, and work-in-process inventory.
Q. How long does it take to create a Value Stream Map?
For a focused value stream, a map can often be created within a day, though data collection may take longer for complex processes.
Q. What are the biggest benefits of Value Stream Mapping?
It helps uncover bottlenecks, reduce waiting time, improve flow, lower inventory, and support data-driven improvement decisions.
Q. What is the most common Value Stream Mapping mistake?
Building the map from assumptions instead of observing the actual process and collecting real data.
Q. Do I need software to create a Value Stream Map?
No. Many successful VSM workshops start with paper, sticky notes, and a whiteboard before moving to digital tools.
Q. What should happen after a Future-State Map is created?
The Future-State Map should be converted into an actionable improvement plan with owners, timelines, and measurable targets.
Q. How often should a Value Stream Map be updated?
Whenever significant process changes occur or major improvements have been implemented.
Q. Is Value Stream Mapping worth the effort?
Absolutely. In my experience, it consistently reveals hidden delays and improvement opportunities that traditional reports often miss.
Lean Six Sigma • Six Sigma • Statistics • Project Management • Artificial Intelligence (AI) • Operations Management • Quality Management
Conclusion
After using Value Stream Mapping across multiple improvement initiatives, one thing has become clear: the biggest opportunities rarely sit inside the process itself. They hide in the time between activities, waiting for the next step, the next decision, or the next piece of information. That's why Value Stream Mapping remains one of my favorite Lean tools. It provides a clear view of how work actually flows, exposes waste that often goes unnoticed, and helps teams focus on improvements that truly matter.
The goal isn't to create a perfect map. The goal is to understand the current reality, design a better future state, and take practical steps toward it.
Whether you're trying to reduce lead time, eliminate bottlenecks, improve customer service, or increase operational efficiency, Value Stream Mapping gives you a structured way to find the gaps and close them. In the end, successful Lean transformation isn't about working harder. It's about improving flow. And few tools help reveal that path better than Value Stream Mapping.
Continue Your Learning Journey
Learning is a continuous process. Explore related topics, practical guides, tools, calculators, templates, and learning resources to expand your knowledge and develop new skills.
Choose a category below to explore practical tutorials, tools, calculators, templates, case studies, and learning resources.
Recommended Learning Resources
Expert-led courses to build practical skills, earn credentials, and advance your career.
Recommended professional books, certification guides, and practical study resources.
Ready-to-use templates, checklists, guides, and workbooks for practical applications.
Interactive calculators for statistics, quality, engineering, analysis, and decision-making.
Interactive Z, t, Chi-Square, and F tables with critical values and distribution curves.
Discover practical tutorials, case studies, and professional resources across Quality, Lean Six Sigma, Project Management, Statistics, AI, and Data Analytics.
Published: August 21, 2026
Last Updated: September 18, 2026