
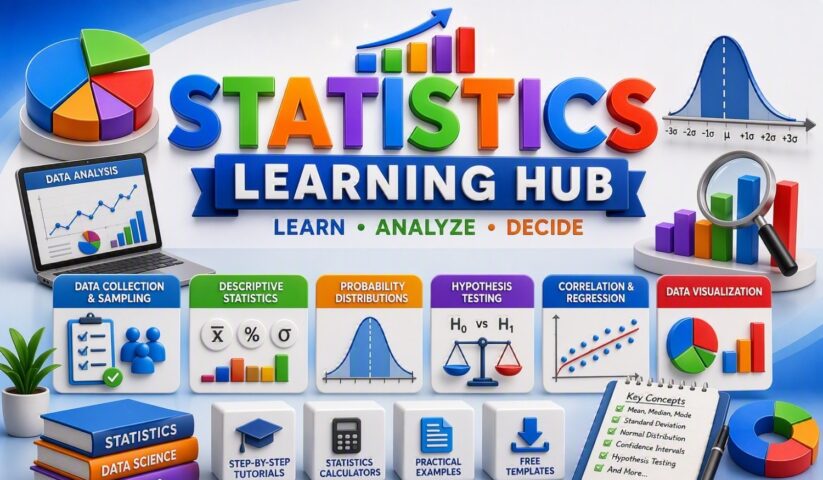
Learn statistics through practical examples, visual explanations, calculators, and real-world applications. Whether you’re a student, quality professional, or project manager, these resources will help you understand data and make better decisions.
📌Why Statistics Matters
Statistics helps professionals make better decisions using data instead of assumptions. Whether you work in quality, manufacturing, healthcare, business, or project management, statistical thinking is essential for solving problems, reducing variation, and improving performance.
To complement the written content, detailed video explanations are also available on the “Digital E-Learning” YouTube channel, providing additional clarity and practical insights.
🎯Who Should Learn Statistics ?
- Students & Researchers
- Quality Engineers & Six Sigma Professionals
- Data Analysts & Business Analysts
- Manufacturing & Operations Professionals
- Anyone Interested in Data-Driven Decision Making
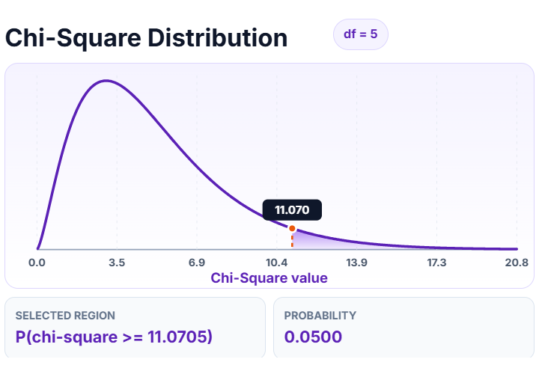
Chi-Square Table (χ² Distribution) Table
Calculate Chi-Square critical values, visualize rejection regions, and explore comprehensive χ² reference tables for statistical ...
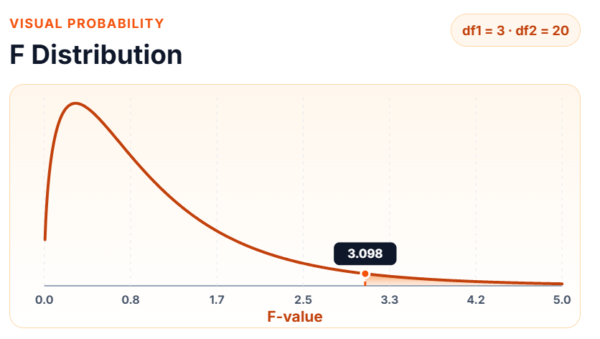
F-Table (F-Distribution Critical Values)
Calculate F critical values, determine statistical significance, visualize F-distribution curves, and explore complete F-table reference ...
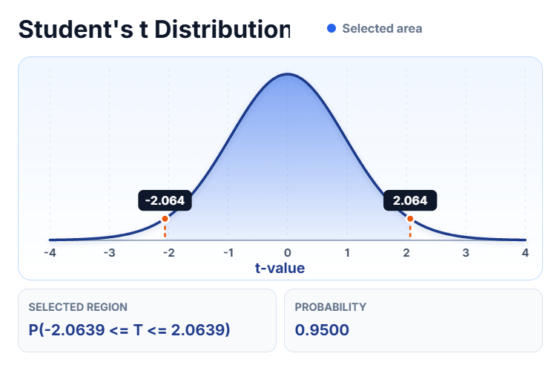
t-Table (Student’s t Distribution Table)
Find Student's t critical values, confidence intervals, and significance levels using an interactive calculator and ...
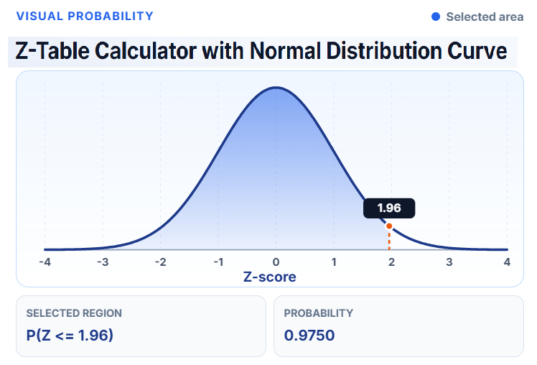
Z-Table (Standard Normal Distribution Table)
Explore standard normal distribution probabilities, Z-scores, percentiles, and confidence levels with an interactive Z-table calculator ...
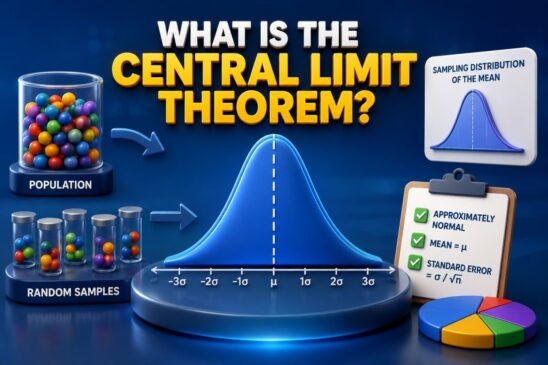
Central Limit Theorem (CLT): The Foundation of Modern Statistics Behind Six Sigma, Quality Engineering & Data Analysis
Learn the Central Limit Theorem (CLT) with easy-to-understand explanations, formula, conditions, assumptions, solved examples, applications, ...
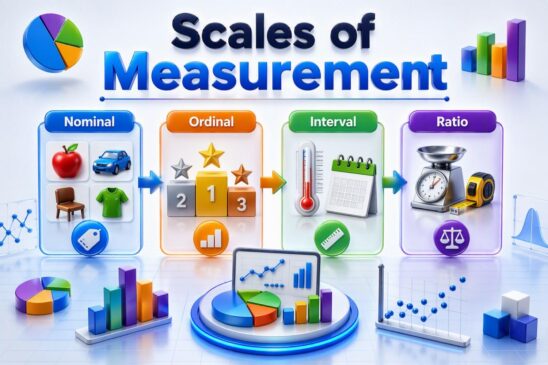
Scales of Measurement: How to Choose the Right Scale (Nominal, Ordinal, Interval & Ratio)
Learn how Nominal, Ordinal, Interval, and Ratio scales are used in statistics, research, data analysis, ...
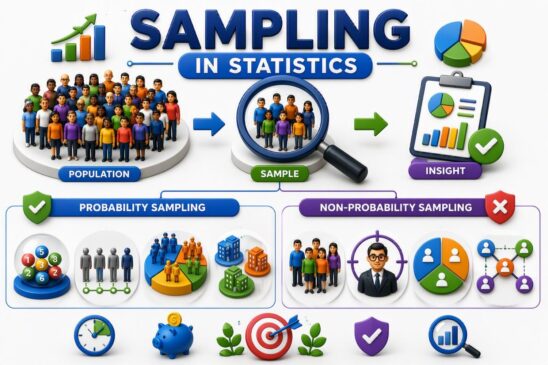
Sampling in Statistics: How to Choose the Right Sampling Method (Probability vs Non-Probability)
Sampling is a statistical technique that allows statistician, researchers to infer about a population based ...
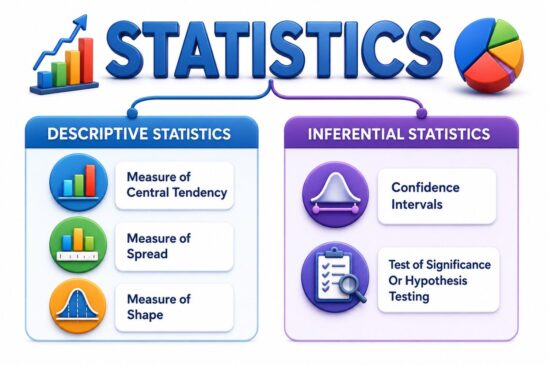
Statistics is more than Math: Why most people Learn Statistics Wrong
Learn statistics the right way by focusing on concepts before formulas. This beginner-friendly guide uses ...
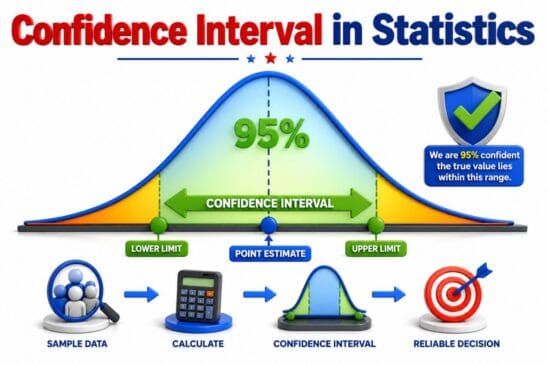
What is a Confidence Interval in Statistics? How to Interpret It Correctly (With Real-World Examples & Calculator)
Confidence interval is the range of estimate we are making. Say for e.g we are ...