
Imagine planning a family wedding. You book the venue first. Only then can you plan decoration. Food depends on guest count. Invitations must go out before the event. Photography needs to be aligned with timing. Now imagine managing all this without understanding the order.
Chaos.
This is exactly what happens in projects without proper planning. In real-world projects—whether building a house, launching a product, or running a Six Sigma improvement initiative—you are not just executing tasks. You are managing interconnected activities. This is where Network Diagrams in Project Management come in.
A Network Diagram helps you visualize:
- What needs to be done
- In what order
- Which tasks depend on others
- And what could delay your project
In simple terms: A network diagram is a visual map of your project showing tasks, sequence, and dependencies, helping you plan and control execution effectively.
This article will guide you step-by-step:
- What network diagrams are
- How they work
- CPM & PERT explained simply
- Real-life examples you can relate to
- A detailed case study
- Practical formulas and beginner-friendly explanations
What is a Network Diagram in Project Management?
A network diagram is a visual representation of project tasks and their relationships. It usually shows a graphical association between different tasks and is used to develop a project schedule and determine the critical paths.
The concept of network diagrams emerged when projects became too complex to manage using simple lists and timelines. Network diagram helps in determining the critical paths. w illustrating these activities either by using nodes or using arrows are the two different ways we can show relationships. Early project managers realized that understanding task relationships was more important than just tracking individual activities. With the rise of large-scale industrial and engineering projects, the need for structured planning tools became essential.
So in this article are going to understand the difference between Activity on Arrow (AOA) and Activity on Node (AON) what calculation we can do based on these networks to better plan our projects by project managers. Have you seen this post.
Both these technique Activity on Arrow (AOA) and Activity on Node (AON) is a part of Program Evaluation and Review Technique (PERT). They are used to evaluate the time which is required complete the task especially if we talk about the complete project. Now how to represent a project in form of diagram which we call it as “Network Diagram”. How is it different from Gantt charts ? So Gantt charts only shows project schedules and focuses on tasks and time, while Network diagram in project management helps in defining the graphical relationship and sequence of tasks or activities to develop a project schedule. That is why network diagram offer broader scope to Project management.
Lets first understand these terms independently.
Activity on Arrow (AOA)
It use arrows to represent activities while Activity on Arrow uses arrows to represent the activities while nodes stand for events.
It shows start to finish types of Relationship. Each node of Activity on Arrow contains three numerical values – the Start Time, the Finish Time and the Float.
Start time : Earliest Start time or the time when activity actually starts.
Finish Time: Earliest finish time or the time when activity actually finishes.
Float: It basically tells how much extra time you have or the the amount of time a task can be delayed without resulting in an overall delay in completion of other tasks. It is calculated as Late Start time – Early Start time or Late Finish time – Early Finish time
Critical Path : is the longest path in terms of time required to complete activity from Start to Finish.
Event : in project management, it’s a specific point of time when something has actually started or finished.
Let’s see one example to help us understand this better.
Circles here represent the node, or the events and Activities are represented on the Arrows like A, B, C etc. So node #1 represent start of Activity “A” and node #3 represent the End of Activity “A” which become the start of Activity “C” and Activity “D”. This Activity “A” will require some resources and time. Similarly, node #2 represent start of Activity “E” and node #6 represent the End of Activity “E” . Here the node #9 is the last node as we don’t have any new which is Emanating or Starting. To understand how this numbering is done we first need to go through Fulkerson’s rule for numbering of nodes.
Predecessor and Successor activities
Here Activity “A” must be completed before we can start Activity “C” and Activity “D”. In short Activity “C” and Activity “D” are dependent on Activity “A” and we call Activity “A” as predecessor for Activity “C” and Activity “D” or in other words Activity “C” and Activity “D” are successor activities to Activity “A”.
Activity-on-Node (AON)
AON or Activity-on-node as the name signifies here the activity is placed on node.

It is also known as Precedence diagramming method. Unlike Activity on Arrow it shows start to start, Finish to Finish, Start to Finish, and Finish to Start types of relationship.
Let’s see one example to help us understand this better.
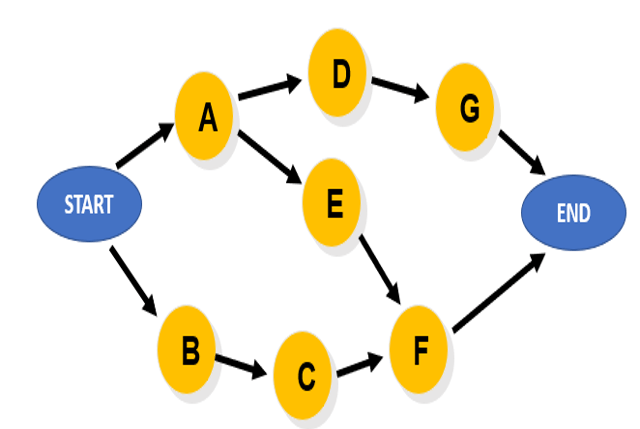
Circles or nodes represent the activities like Activity A, B, C etc. 1st node is always the START and Last node is the END node. Here Activity A and Activity B are starting at same time. Activity F cannot start until Activity E and Activity C both have been completed.
So the ultimate choice between Activity on Arrow and Activity on Node is purely a matter of personal choice.

Activity-on-Node
Interpretation
Activity-on-Arrow
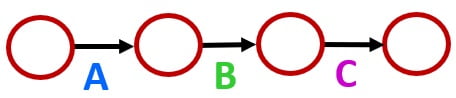
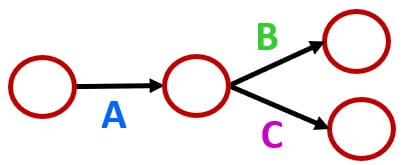
Activity A comes before Activity B, which comes before Activity C
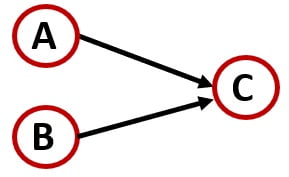
Activity A and Activity B must both be completed before Activity C can start

Activity B and Activity C cannot begin until Activity A is completed

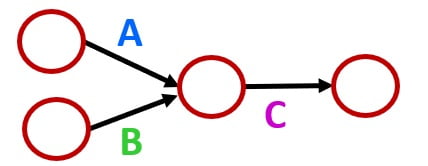
Activity C and Activity D cannot begin until Activity A and Activity B have both been completed


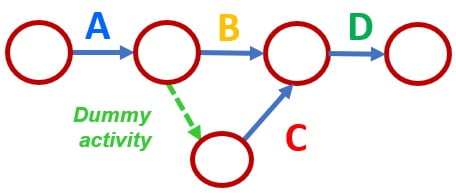
Activity C cannot begin until both Activity A and Activity B are completed; Activity D cannot begin until Activity B is completed. A dummy activity is introduced in AOA
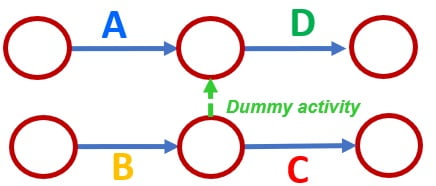

Activity B and Activity C cannot begin until Activity A is completed. Activity D cannot begin until both Activity B and Activity C are completed. A dummy activity is again introduced.
Watch this animated YouTube video for more details :
FAQs on Network Diagrams
What is a network diagram in project management?
A network diagram is a visual representation of project tasks and their dependencies.
Why is a network diagram important?
It helps plan, schedule, and manage task relationships efficiently.
What is the critical path?
The critical path is the longest sequence of tasks that determines project duration.
What is CPM in project management?
CPM is a method used to identify the critical path and optimize project timelines.
What is PERT used for?
PERT is used to estimate project time when activity durations are uncertain.
What is float or slack?
Float is the extra time a task can be delayed without affecting the project.
What is an AON network diagram?
AON represents tasks as nodes and dependencies as arrows.
What is an AOA network diagram?
AOA represents tasks as arrows and events as nodes.
How is a network diagram created?
It is created by listing tasks, defining dependencies, and connecting them logically.
What is the benefit of identifying the critical path?
It helps ensure the project is completed on time by focusing on critical tasks.
I hope this blog helped in understanding the basic concept in a simplified manner, watch out for I hope this blog helped in understanding the basic concept in a simplified manner, watch out for more such stuff in the future.
📢📢 𝑺𝒐𝒄𝒊𝒂𝒍 𝑴𝒆𝒅𝒊𝒂 𝑳𝒊𝒏𝒌:
Thanks!!!
For questions please leave them in the comment box below and I’ll do my best to get back to those in a timely fashion. And remember to subscribe to Digital eLearning YouTube channel to have our latest videos sent to you while you sleep.
✍️ 𝓓𝓲𝓼𝓬𝓵𝓪𝓲𝓶𝓮𝓻: Copyright Disclaimer under section 107 of the Copyright Act of 1976, allowance is made for “fair use” for purposes such as criticism, comment, news reporting, teaching, scholarship, education and research. Fair use is a use permitted by copyright statute that might otherwise be infringing. The information contained in this video is just for educational and informational purposes only and does not have any intention to mislead or violate Google and YouTube community guidelines or policy. I respect and follow all terms & conditions of Google & YouTube.


