Introduction: Why Your “95% Yield” Might Be Misleading
Imagine you are managing a manufacturing line. Every department proudly reports a 95% success rate. Everything seems excellent — until you realize that customers are still complaining, costs are rising, and rework is eating away your productivity.
Sounds familiar?
This is one of the most common traps in process improvement. On paper, everything looks efficient. But in reality, defects occur at multiple stages, get repaired, and quietly inflate your performance numbers.
This is where Rolled Throughput Yield (RTY) becomes a powerful truth-teller.
RTY doesn’t just ask: “How many products passed?”
Instead, it asks: “How many products passed every step without a single defect?”
That one shift in perspective completely changes how you view quality, efficiency, and cost.
What is Rolled Throughput Yield (RTY)?
Rolled Throughput Yield (RTY) is the probability that a product or service passes through an entire process without any defects or rework One of the best metrics that companies use to evaluate their process performance is this Rolled Throughput Yield (RTY) but many companies don’t even know what is this Rolled Throughput Yield (RTY) and how to find out RTY in the correct way. So if you are one of them then this blog is specially for you.
In simple words:
RTY tells you how many units are perfect from start to finish — the first time.
Before understanding what is Rolled Throughput Yield ? Let’s us first familiarize with word “Yield” and TPY (Throughput Yield). Many companies don’t know how to find out RTY in the correct way. The below example will helps clear all the confusion related to Rolled Throughput Yield .
Let’s break that down.
- A product might fail at Step 1 → reworked → passes
- Then fail again at Step 3 → reworked → passes
At the end, the product ships successfully.
Traditional yield counts this as a success.
But RTY says:
❌ This is NOT a perfect product.
Because defects occurred along the way.
What is Yield :
Yield, also commonly referred to as First Time Yield, represents the percentage of non-defective items out of the total items produced in a process. In simple terms, it answers a very basic question:
Out of everything we produced, how many units were good without any defects?
It is one of the most fundamental performance indicators in quality management and is widely used in manufacturing as well as service processes. However, while yield gives a quick snapshot of performance, it does not always reflect the true efficiency of a process, especially when rework activities are involved.
First Time Yield
First Time Yield (FTY) is simply the number of good units produced divided by the number of total units going into the process. First time yield takes in to account what goes into a process as Input and what comes out as Output without the consideration of rework.
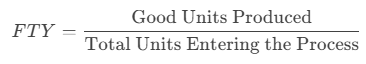
In simple words, FTY considers:
- What goes into the process as input
- What comes out of the process as output
However, it does not take into account any rework or correction activities that may have occurred during the process. Even if a defective unit is repaired and finally delivered as a good unit, FTY will still count it as acceptable output. This is where many organizations get misled — because the numbers look good on paper, but in reality, the process may be inefficient due to hidden rework, delays, and added costs.
Example:
-Total units produced=100 units .
-Total units pass compliance check=85 units
-Number of defective units=> 100-85=15
-Process Yield = 85/100=85%
This means the process yield of that particular product is 85% i.e 85 units are defect free and have passed compliance check successfully.
TPY : Throughput Yield
To overcome this limitation, we use Throughput Yield (TPY). TPY focuses on the probability that a unit passes a particular process step without any defects or rework. It gives a more realistic picture compared to simple yield because it considers the quality at each stage. Throughput Yield is also known as First Pass Yield (FPY) . It is defined as the number of units coming out of a process divided by the number of units going into that process over a specified period of time.
In other words, TPY answers:
What is the chance that a unit will pass this step perfectly the first time?
Once we clearly understand Yield, FTY, and TPY, it becomes much easier to understand Rolled Throughput Yield (RTY), which combines these concepts across multiple process steps and gives the true overall performance of the entire process.
First pass yield is different, and it takes in to account what goes into a process as Input and what comes out as Output with the consideration of rework.
Rolled Throughput yield (RTY)
Rolled Throughput yield (RTY) is a metric that takes in to account entire process steps or operations from start to end. It is defined in percentage as probability that particular process with more than one steps will produce defect free parts. It is calculated by defining the Throughput Yield for each sub process and then based on whether these processes are in series or Parallel or combination we calculate RTY. Example:
-Total units produced=10 units
-Total units pass compliance check for 1st Process =10-2-2 units
–TPY for Process (1) = 6/10 = 60%
-Total units pass compliance check for 2nd Process =8-1-0 units
–TPY for Process (2) = 7/8 = 87.5%
-Total units pass compliance check for 3rd Process =8-1-1 units
–TPY for Process (3) = 6/8 = 75%
–RTY= TPY 1 x TPY 2 x TPY 3
–RTY= 60*87.5*75 = 40 %
How to Calculate Rolled Throughput Yield for 3 different cases :
Another way to calculate rolled through yield is by using formula RTY = e-DPU ., Where DPU = Defect per Units. So lets understand these three cases :
- Case 1: Process are in arranged in Series.
- Case 2: Process are arranged in Parallel.
- Case 3: Process are arranged in combination of Series and Parallel.
Let’s see first how to calculate RTY for series and Parallel.
Case 1: Process are in arranged in Series. Let assume the Process A, B and C operates in series. 10 Parts enter Process A, 2 are rejected and only 8 parts are good. These 8 parts enter Process B, 1is rejected and only 7 parts are good. Now these 7 parts enter Process C, 1is rejected and only 6 parts are good. Lets calculate the TPY for each process in series:
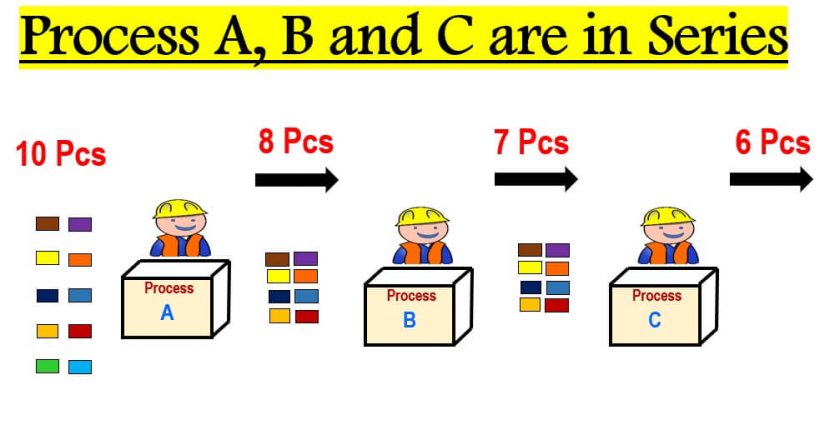
TPY (Process A)= e-DPU TPY (Process B)= e-DPU TPY (Process C)= e-DPU
DPUA = 2/10= 0.2 DPUB = 1/8= 0.2 DPUc = 1/7 = 0.1
DPUA = 0.2 DPUB = 0.125 DPUC = 0.142
TPY A= e-0.2 TPY B = e-0.125 TPY C = e-0.142
TPY A= 0.8187 TPY B = 0.8824 TPY C = 0.8676
RTY = Process ATPY * Process BTPY * Process CTPY
RTY = 0.8187* 0.8824* 0.8676
RTY (Series) = 0.626
Case 2: Process are arranged in Parallel. Let assume the Process D, E and F operates in parallel. 10 Parts enter Process A, 2 are rejected and only 8 parts are good. 10 Parts enter Process B, 3 are rejected and only 7 parts are good. 10 Parts enter Process C, 1 are rejected and only 9 parts are good. Lets calculate the TPY for each process in Parallel:

TPY (Process D)= e-DPU TPY (Process E)= e-DPU TPY (Process F)= e-DPU
DPUD = 2/10= 0.2 DPUE = 3/10= 0.3 DPUF = 1/10 = 0.1
DPUD = 0.2 DPUE = 0.3 DPUF = 0.1
TPY D= e-0.2 TPY E = e-0.3 TPY F = e-0.1
TPY D= .8187 TPY E = .7408 TPY F = .9048
RTY = Minimum of ( Process DTPY OR Process ETPY OR Process FTPY
RTY = 0.8187* 0.7408* 0.9048
RTY (Parallel) = 0.5487
Case 3: Process are arranged in combination of Series and Parallel. Let assume the Process A, B operates in Parallel and C in series . 10 Parts enter Process A, 2 are rejected and only 8 parts are good. 10 Parts enter Process B, 3 are rejected and only 7 parts are good. These two process A and B are in Parallel. so we will first calculate the TPY for each process and later Process AB and Process C are in Series.
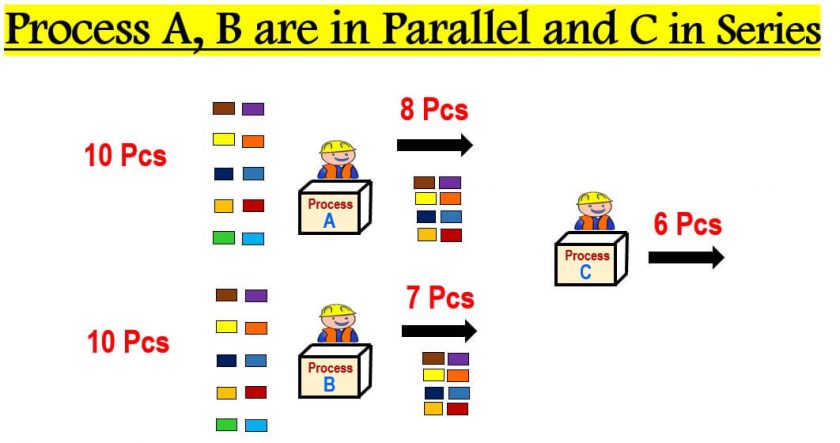
TPY (Process A)= e-DPU TPY (Process B)= e-DPU
DPUA = 2/10= 0.2 DPUB = 3/10= 0.3
DPUA = 0.2 DPUB= 0.3
TPY A= e-0.2 TPY B = e-0.3
TPY A= .8187 TPY B = .7408
RTY ( AB ) = Minimum of ( Process ATPY OR Process BTPY )
RTY ( AB ) = 0.8187 OR 0.7408
RTY ( AB ) = 0.7408
Now Process C is in Series with both Process A and Process B
Lets first calculate : TPY (Process C)= e-DPU =
DPUC = 1/7 = 0.1428
TPY (Process C)= e-DPU = e-0.1428 =.8669
TPY (Process C) =0.8689
RTY (Total) = RTY( AB ) * TPY (Process C)= e-DPU
RTY (Total) = 0.7408 * 0.8689
RTY (Total) = 0.6422
Watch this animated YouTube video for more details explanation :
Frequently Asked Questions (FAQ) about rolled throughput yield :
Q: What is Rolled Throughput Yield (RTY)?
A: Rolled Throughput Yield (RTY) is a statistical metric used to measure the overall quality performance of a process that consists of multiple stages or steps. It calculates the probability of producing a defect-free product or service throughout the entire process.
Q: How is RTY different from First Pass Yield (FPY)?
A: While both RTY and FPY are quality metrics, they differ in their scope. FPY measures the percentage of units that pass the entire process without any defects on the first attempt. On the other hand, RTY takes into account the entire process and includes units that might have failed in previous stages but were reworked and eventually passed at a later stage.
Q: Why is RTY important in process improvement?
A: RTY is essential in process improvement because it provides a more realistic view of the process’s quality. It takes into account the cumulative effect of defects in each stage, helping identify bottlenecks and areas for improvement in the process.
Q: How is RTY calculated?
A: RTY is calculated by multiplying the individual yields of each step or stage in the process. The formula for calculating RTY is: RTY = Yield1 * Yield2 * Yield3 * … * YieldN, where Yield1, Yield2, etc., represent the yields of each step in the process.
Q: What is the ideal RTY value?
A: The ideal RTY value is 1, indicating a perfect process with no defects. However, achieving an RTY of 1 may be challenging in real-world scenarios. The goal of process improvement efforts is to get as close to an RTY of 1 as possible.
Q: How can RTY be improved?
A: To improve RTY, organizations should focus on reducing defects at each stage of the process. This can be achieved through various methods such as process standardization, employee training, use of quality tools like Six Sigma or Lean, and implementing feedback loops for continuous improvement.
Q: Can RTY be greater than 1?
A: No, RTY cannot be greater than 1. It represents the probability of producing a defect-free product, and probabilities range from 0 to 1. An RTY greater than 1 would indicate a faulty calculation.
Q: What are the limitations of RTY?
A: RTY is based on the assumption that defects are independent of each other and occur randomly. In complex processes, this assumption might not hold true, leading to limitations in the accuracy of RTY calculations. Additionally, RTY does not consider the severity of defects; all defects are treated equally.
Q: Can RTY be applied to non-manufacturing processes?
A: Yes, RTY can be applied to both manufacturing and non-manufacturing processes. It is a versatile metric used in various industries to assess and improve process quality, efficiency, and effectiveness.
Q: Is RTY the only metric to measure process quality?
A: No, RTY is one of several metrics used to measure process quality. Other commonly used metrics include Defects Per Million Opportunities (DPMO), Process Capability Index (Cpk), and Process Performance Index (Ppk). The choice of metric depends on the specific needs and characteristics of the process being analyzed.
Benefits of calculating rolled throughput yield
Calculating Rolled Throughput Yield (RTY) offers several benefits, particularly in process improvement and quality management. Some of the key advantages include:
- Comprehensive view of process quality: RTY considers the cumulative effect of defects across multiple stages or steps in a process. It provides a more realistic and comprehensive assessment of process quality compared to single-stage metrics like First Pass Yield (FPY).
- Identifying weak points: By calculating RTY, organizations can identify specific stages in the process where defects accumulate or where the yield is low. This helps pinpoint weak points or bottlenecks that need improvement.
- Quantifying process improvement: RTY allows organizations to track the impact of process improvement efforts over time. As defects are reduced at each stage, the RTY increases, providing a tangible measure of improvement.
- Focus on continuous improvement: The RTY calculation encourages a focus on continuous improvement. Organizations can set goals to increase RTY and implement strategies to achieve those objectives.
- Better resource allocation: Understanding the stages with the lowest yield helps allocate resources and efforts effectively. By targeting improvement efforts where they are most needed, organizations can optimize their resources.
- Enhanced customer satisfaction: Higher RTY indicates a more reliable and defect-free process. This, in turn, leads to improved product or service quality, ultimately enhancing customer satisfaction and loyalty.
- Decision-making support: RTY provides data-driven insights that support decision-making processes. It helps managers and stakeholders identify areas that require attention and prioritize improvement initiatives.
- Root cause analysis: When defects occur, RTY aids in root cause analysis by helping identify the stage(s) in the process responsible for the majority of defects. This information is valuable for implementing corrective actions.
- Process benchmarking: RTY can be used for benchmarking against industry standards or best practices. It allows organizations to compare their process performance with others in the same field.
- Cost savings: Improving RTY leads to reduced waste, rework, and scrap. As defects decrease, the costs associated with defects decrease, leading to potential cost savings for the organization.
Conclusion
Rolled Throughput Yield (RTY) is far more than just a quality metric—it is a reality lens for your entire process. In many organizations, performance looks impressive on paper because final output numbers are high. However, these numbers often hide a significant amount of rework, waste, defects, and inefficiencies. RTY cuts through this illusion by focusing on what really matters:
How many products or services are delivered perfectly — without any defect — the first time?
This single perspective shift helps organizations move from reactive problem-solving (fixing defects) to proactive quality improvement (preventing defects).
In summary, calculating Rolled Throughput Yield provides valuable insights into the overall quality and efficiency of a process. It serves as a useful tool for process improvement initiatives, leading to enhanced productivity, customer satisfaction, and cost-effectiveness for the organization.
I hope this blog helped in understanding the basic concept in a simplified manner, watch out for I hope this blog helped in understanding the basic concept in a simplified manner, watch out for more such stuff in the future.
📢📢 𝑺𝒐𝒄𝒊𝒂𝒍 𝑴𝒆𝒅𝒊𝒂 𝑳𝒊𝒏𝒌:
Thanks!!!
For questions please leave them in the comment box below and I’ll do my best to get back to those in a timely fashion. And remember to subscribe to Digital eLearning YouTube channel to have our latest videos sent to you while you sleep.
✍️ 𝓓𝓲𝓼𝓬𝓵𝓪𝓲𝓶𝓮𝓻: Copyright Disclaimer under section 107 of the Copyright Act of 1976, allowance is made for “fair use” for purposes such as criticism, comment, news reporting, teaching, scholarship, education and research. Fair use is a use permitted by copyright statute that might otherwise be infringing. The information contained in this video is just for educational and informational purposes only and does not have any intention to mislead or violate Google and YouTube community guidelines or pe infringing. The information contained in this video is just for educational and informational purposes only and does not have any intention to mislead or violate Google and YouTube community guidelines or policy. I respect and follow all terms & conditions of Google & YouTube.