Z-Table Calculator with Normal Distribution Curve
Calculate Z-scores, cumulative probabilities, percentiles, tail areas, and critical values with a visual standard normal distribution curve.
Standard Normal Distribution
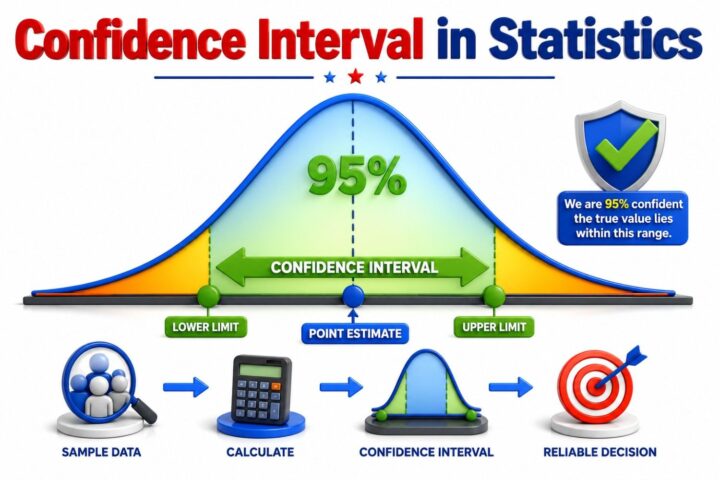
The standard normal curve displays the selected probability.
Choose a Calculation
Results
What this result means
View Step-by-Step Solution
Try an Example
What Is a Z-Score?
A Z-score measures how many standard deviations a value is above or below the mean.
- x = observed or raw value
- μ = population mean
- σ = population standard deviation
Common Critical Z-Values
| Confidence | Two-sided critical Z |
|---|---|
| 80% | ±1.282 |
| 90% | ±1.645 |
| 95% | ±1.960 |
| 98% | ±2.326 |
| 99% | ±2.576 |
| 99.9% | ±3.291 |
Cumulative Z-Table
This table shows the cumulative area to the left of a positive Z-score: Φ(z) = P(Z ≤ z). For negative values, use Φ(−z) = 1 − Φ(z).
Calculation Method
Probabilities are calculated using a numerical approximation of the standard normal cumulative distribution function. Results may differ slightly from printed Z-tables because of rounding.
Educational purpose: This calculator supports learning and statistical problem-solving. Verify critical decisions using an appropriate statistical method and qualified professional review.
Created by Digital E-Learning
Published: August 27, 2026
Last Updated: August 27, 2026